
Monitor your website with YAML using the Open Source project Kestra
With YAML config create a Kestra Flow that monitors your website which will create a GitHub issues on the repo when your website is down and more!

If you prefer to watch the video, YouTube link at the end of the page 👇
What am I going to build?
I am going to create a website monitoring tool that will check if my website is up or down. This will be on a scheduler (cron) every 15 minutes and the response should be a status code of 200. If not, then it will create a GitHub Issue with a label on my GitHub repo.
Here is an example:
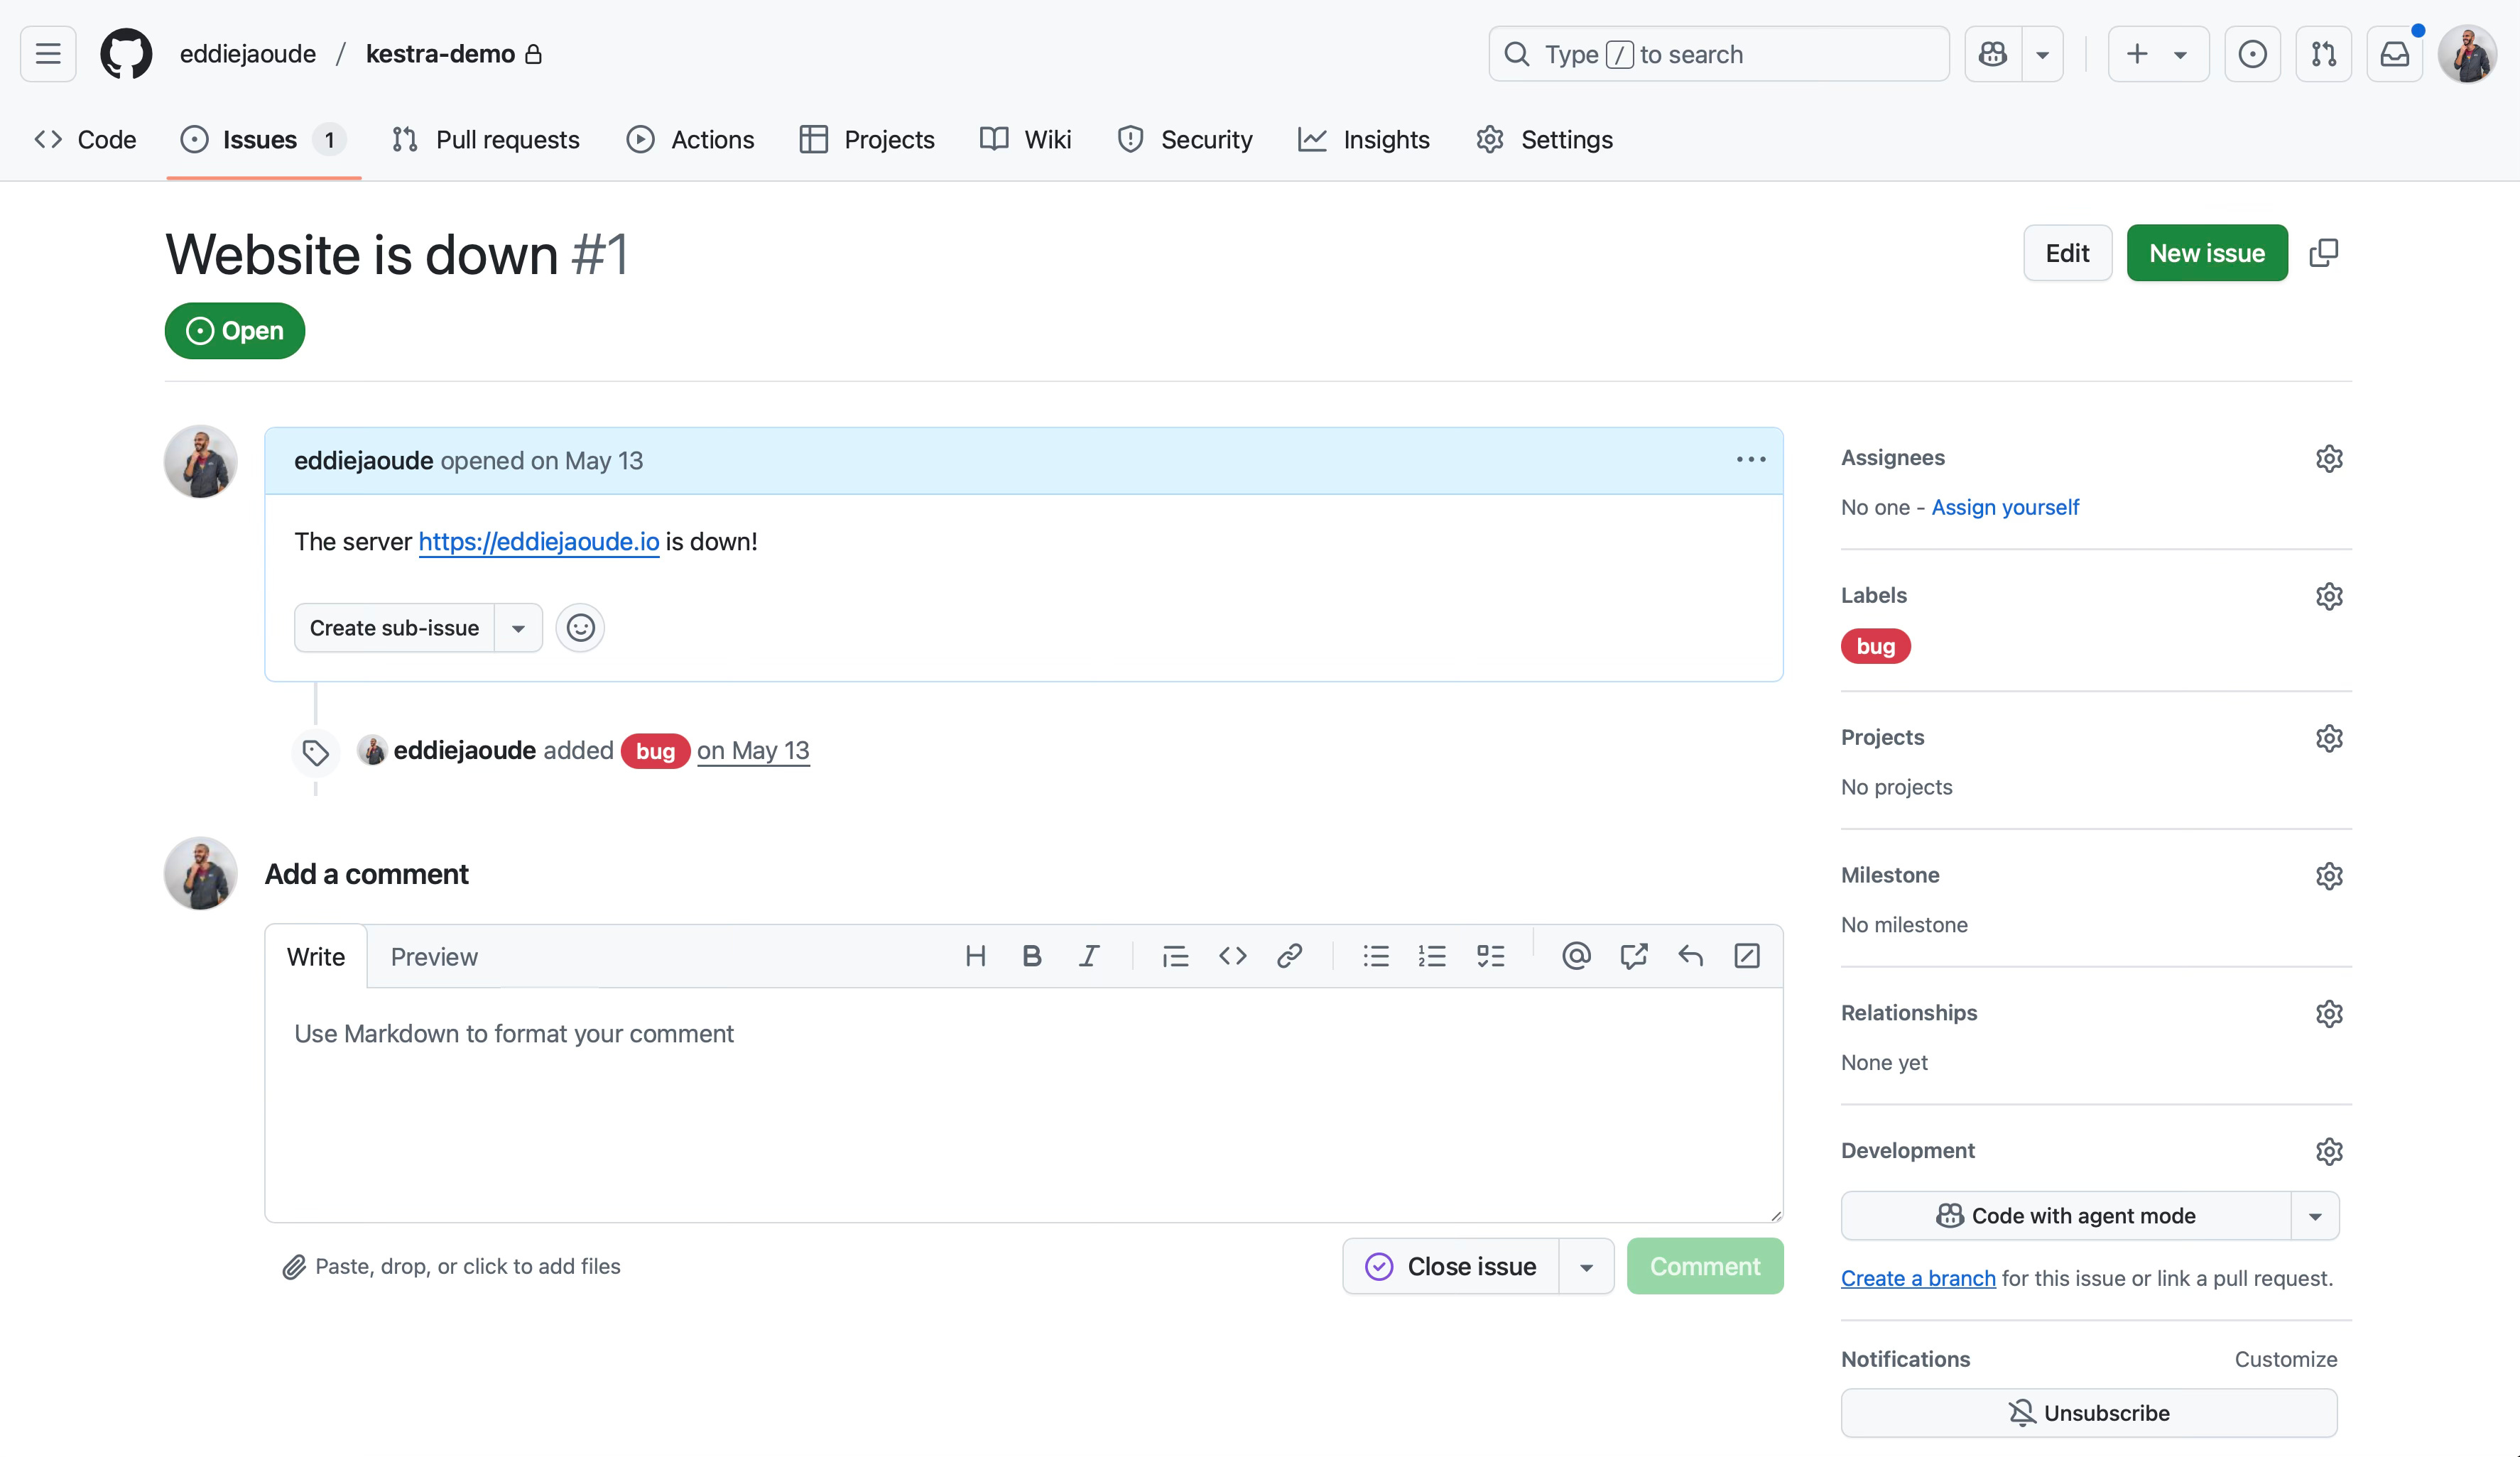
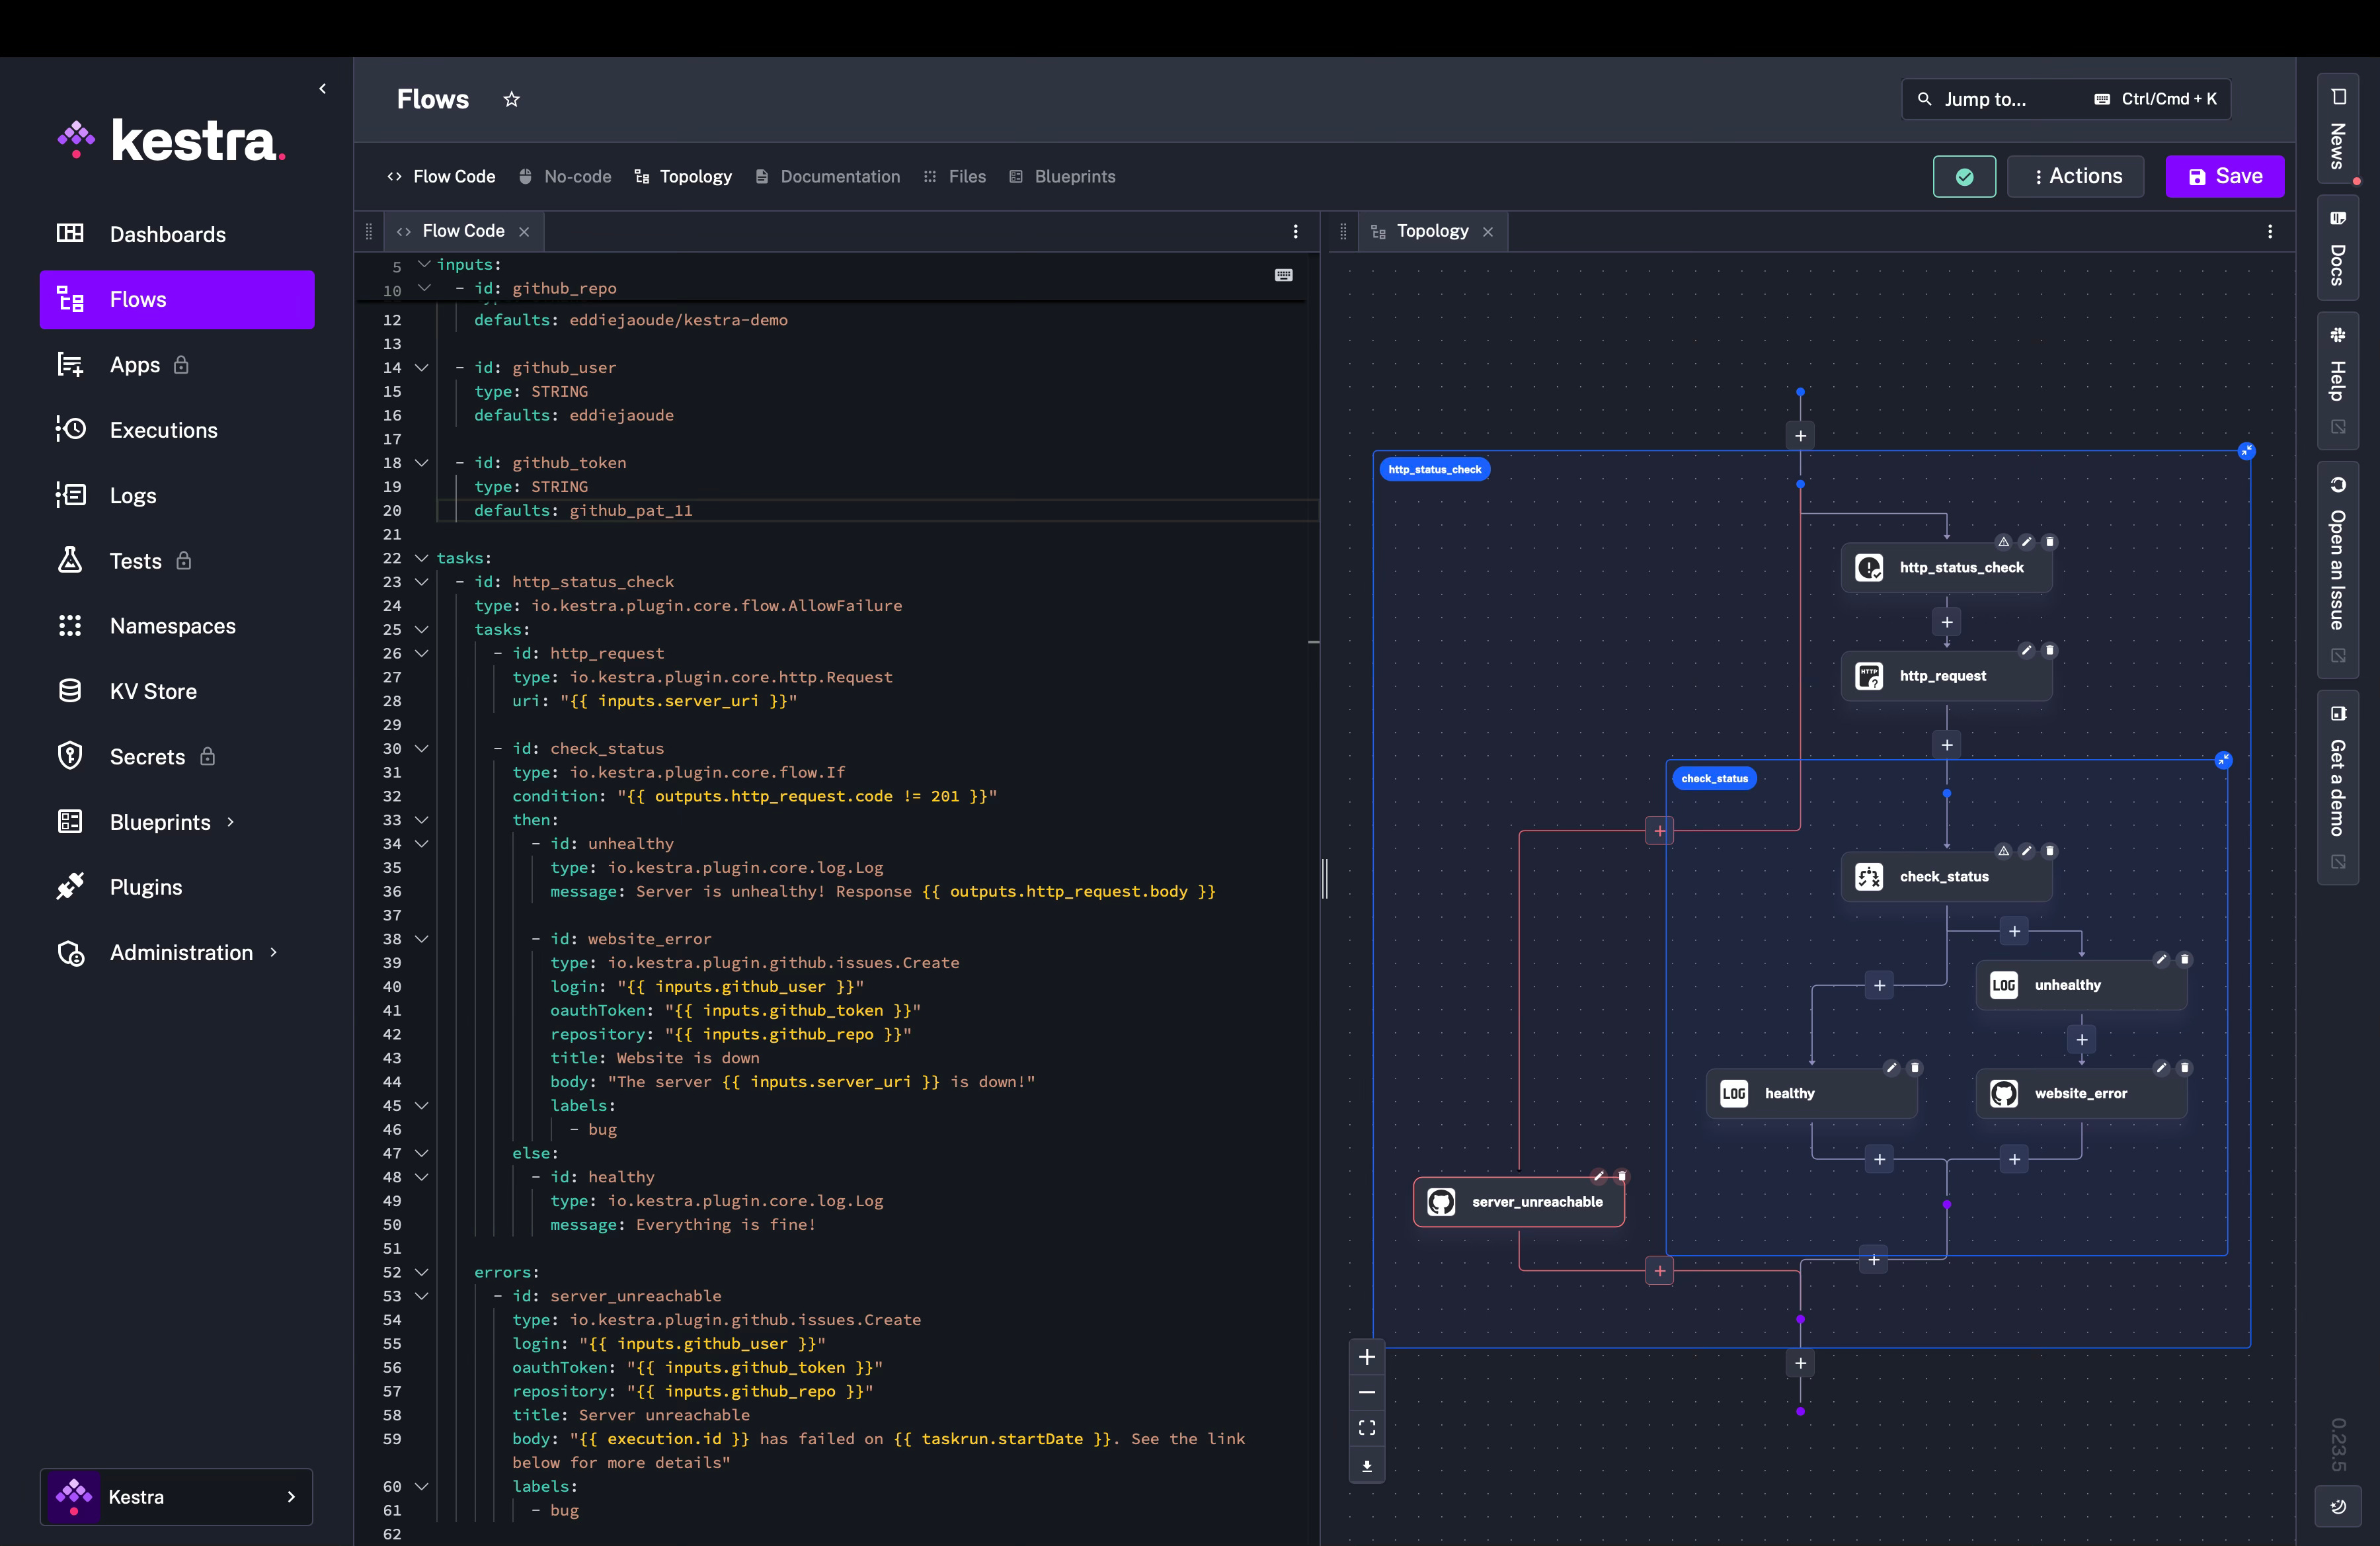
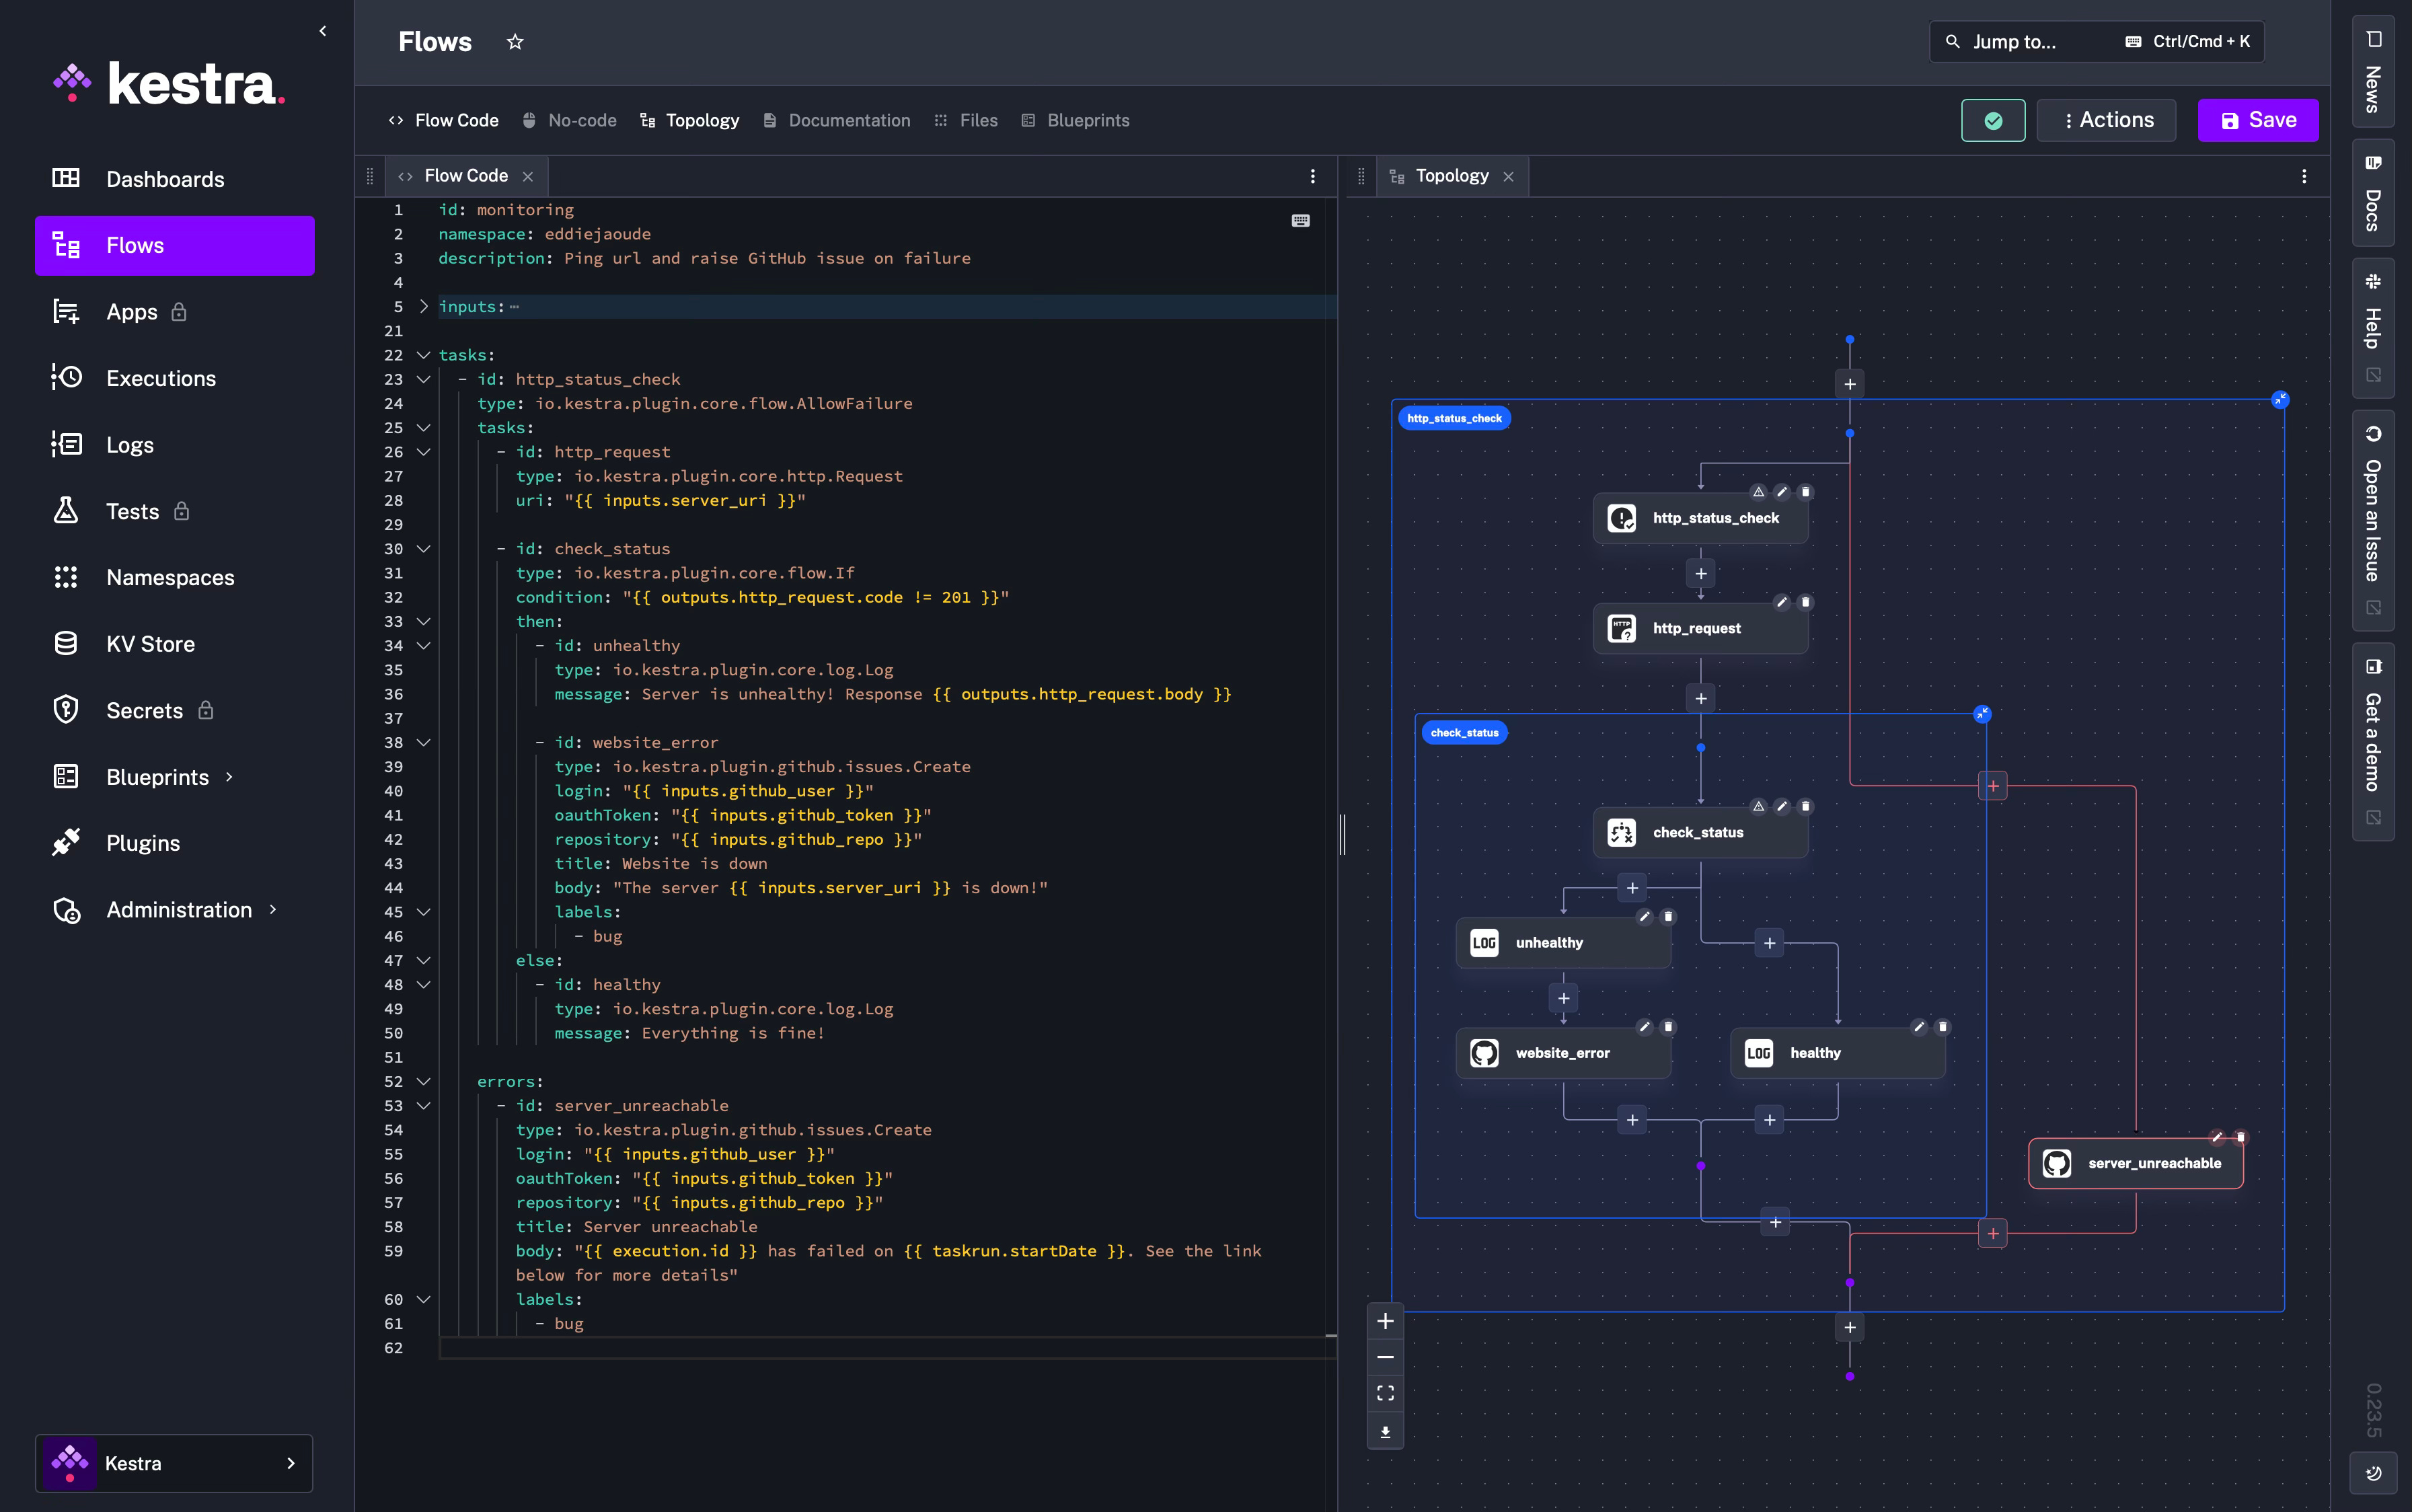
Spoiler alert! This was done with the following YAML on Kestra and below is the Topology diagram it creates of the flow. Super visual!
What is the Open Source project Kestra?
I decided to use Kestra as it is a powerful orchestration tool that simplifies workflows. It uses declarative syntax and has the functionality of multiple Event Based Triggers. What I really like is that Kestra has a great UI and code editor, so I can comfortably stay in the YAML config, see any errors I make immediately as well as getting the visual result in the diagram it produces. But, if you don’t want to use YAML and prefer to only use the UI, you can stay in that view also.
Plus Kestra has over 600 plugins which allow you to integrate with other services very easily. For example: sending notifications to Slack and creating GitHub Issues and so many more. With these building blocks, just like in Lego, we can create anything we need or can imagine.
Also there are over 250 Blueprints which are complete workflows you can easily use as a starting point and tweak to suit your situation.
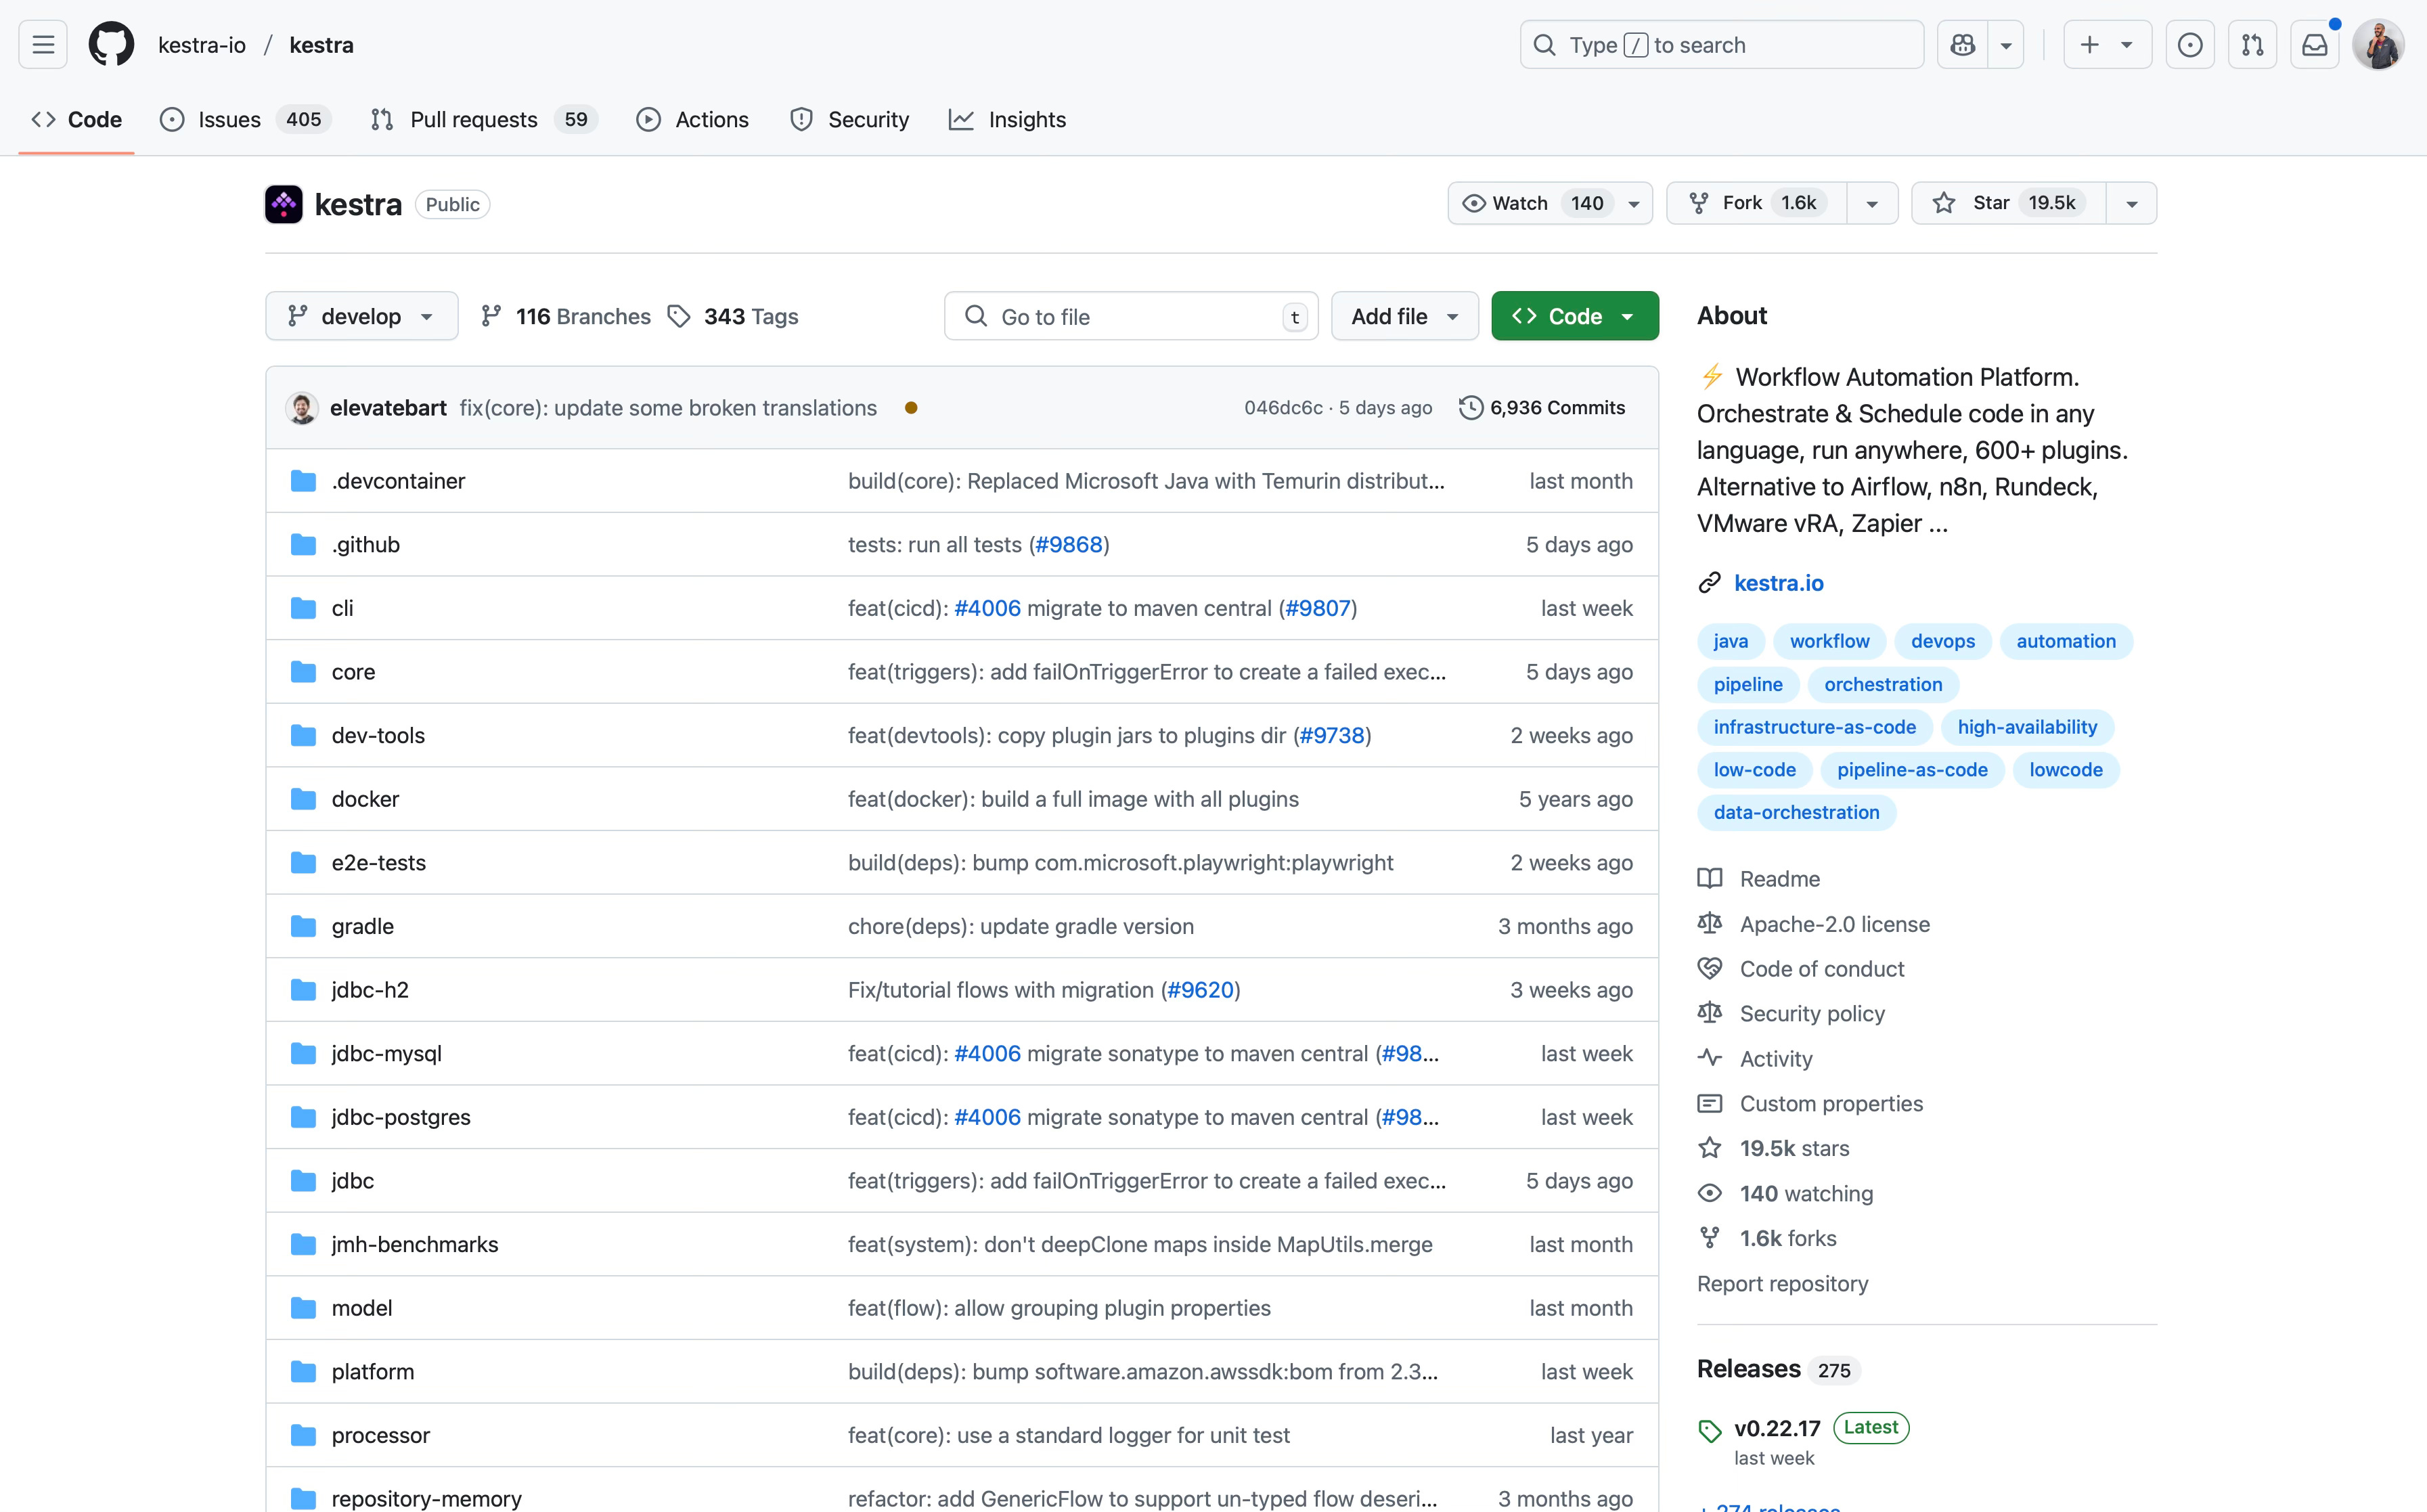
A big bonus for me is that Kestra is Open Source and currently its repo has almost 20k stars. I have contributed to the Kestra Open Source project and if you want to do the same, I would suggest checking out Kestra’s Open Source repos and filtering through the label “good first issues” as a great way to get started.

Setup with Docker compose
Firstly I will get the Kestra project running. There are multiple ways to do this but for this blog post I will run it with Docker composer:
Make sure you have Docker and Docker compose installed and running to use these commands
curl -o docker-compose.yml \
https://raw.githubusercontent.com/kestra-io/kestra/develop/docker-compose.yml

docker-compose up -d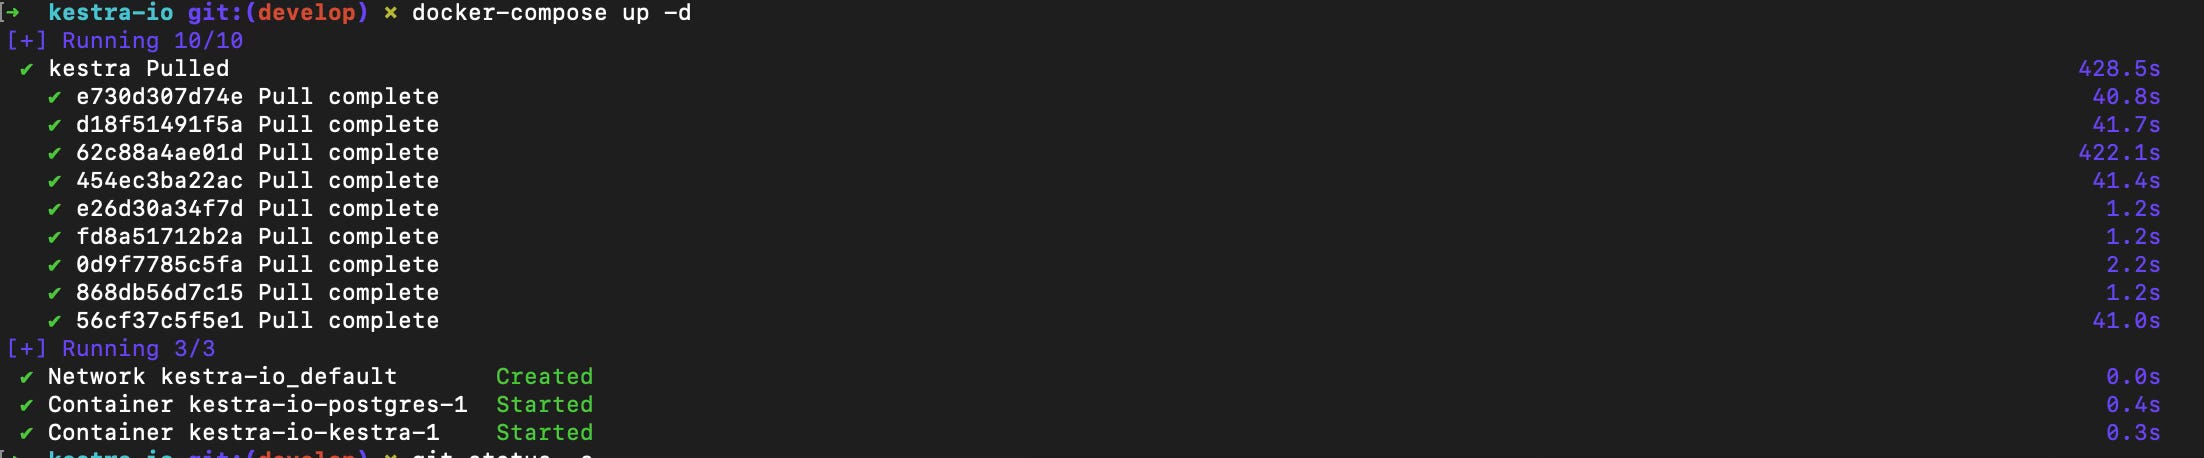
Visit http://localhost:8080 and you will see your Kestra dashboard:
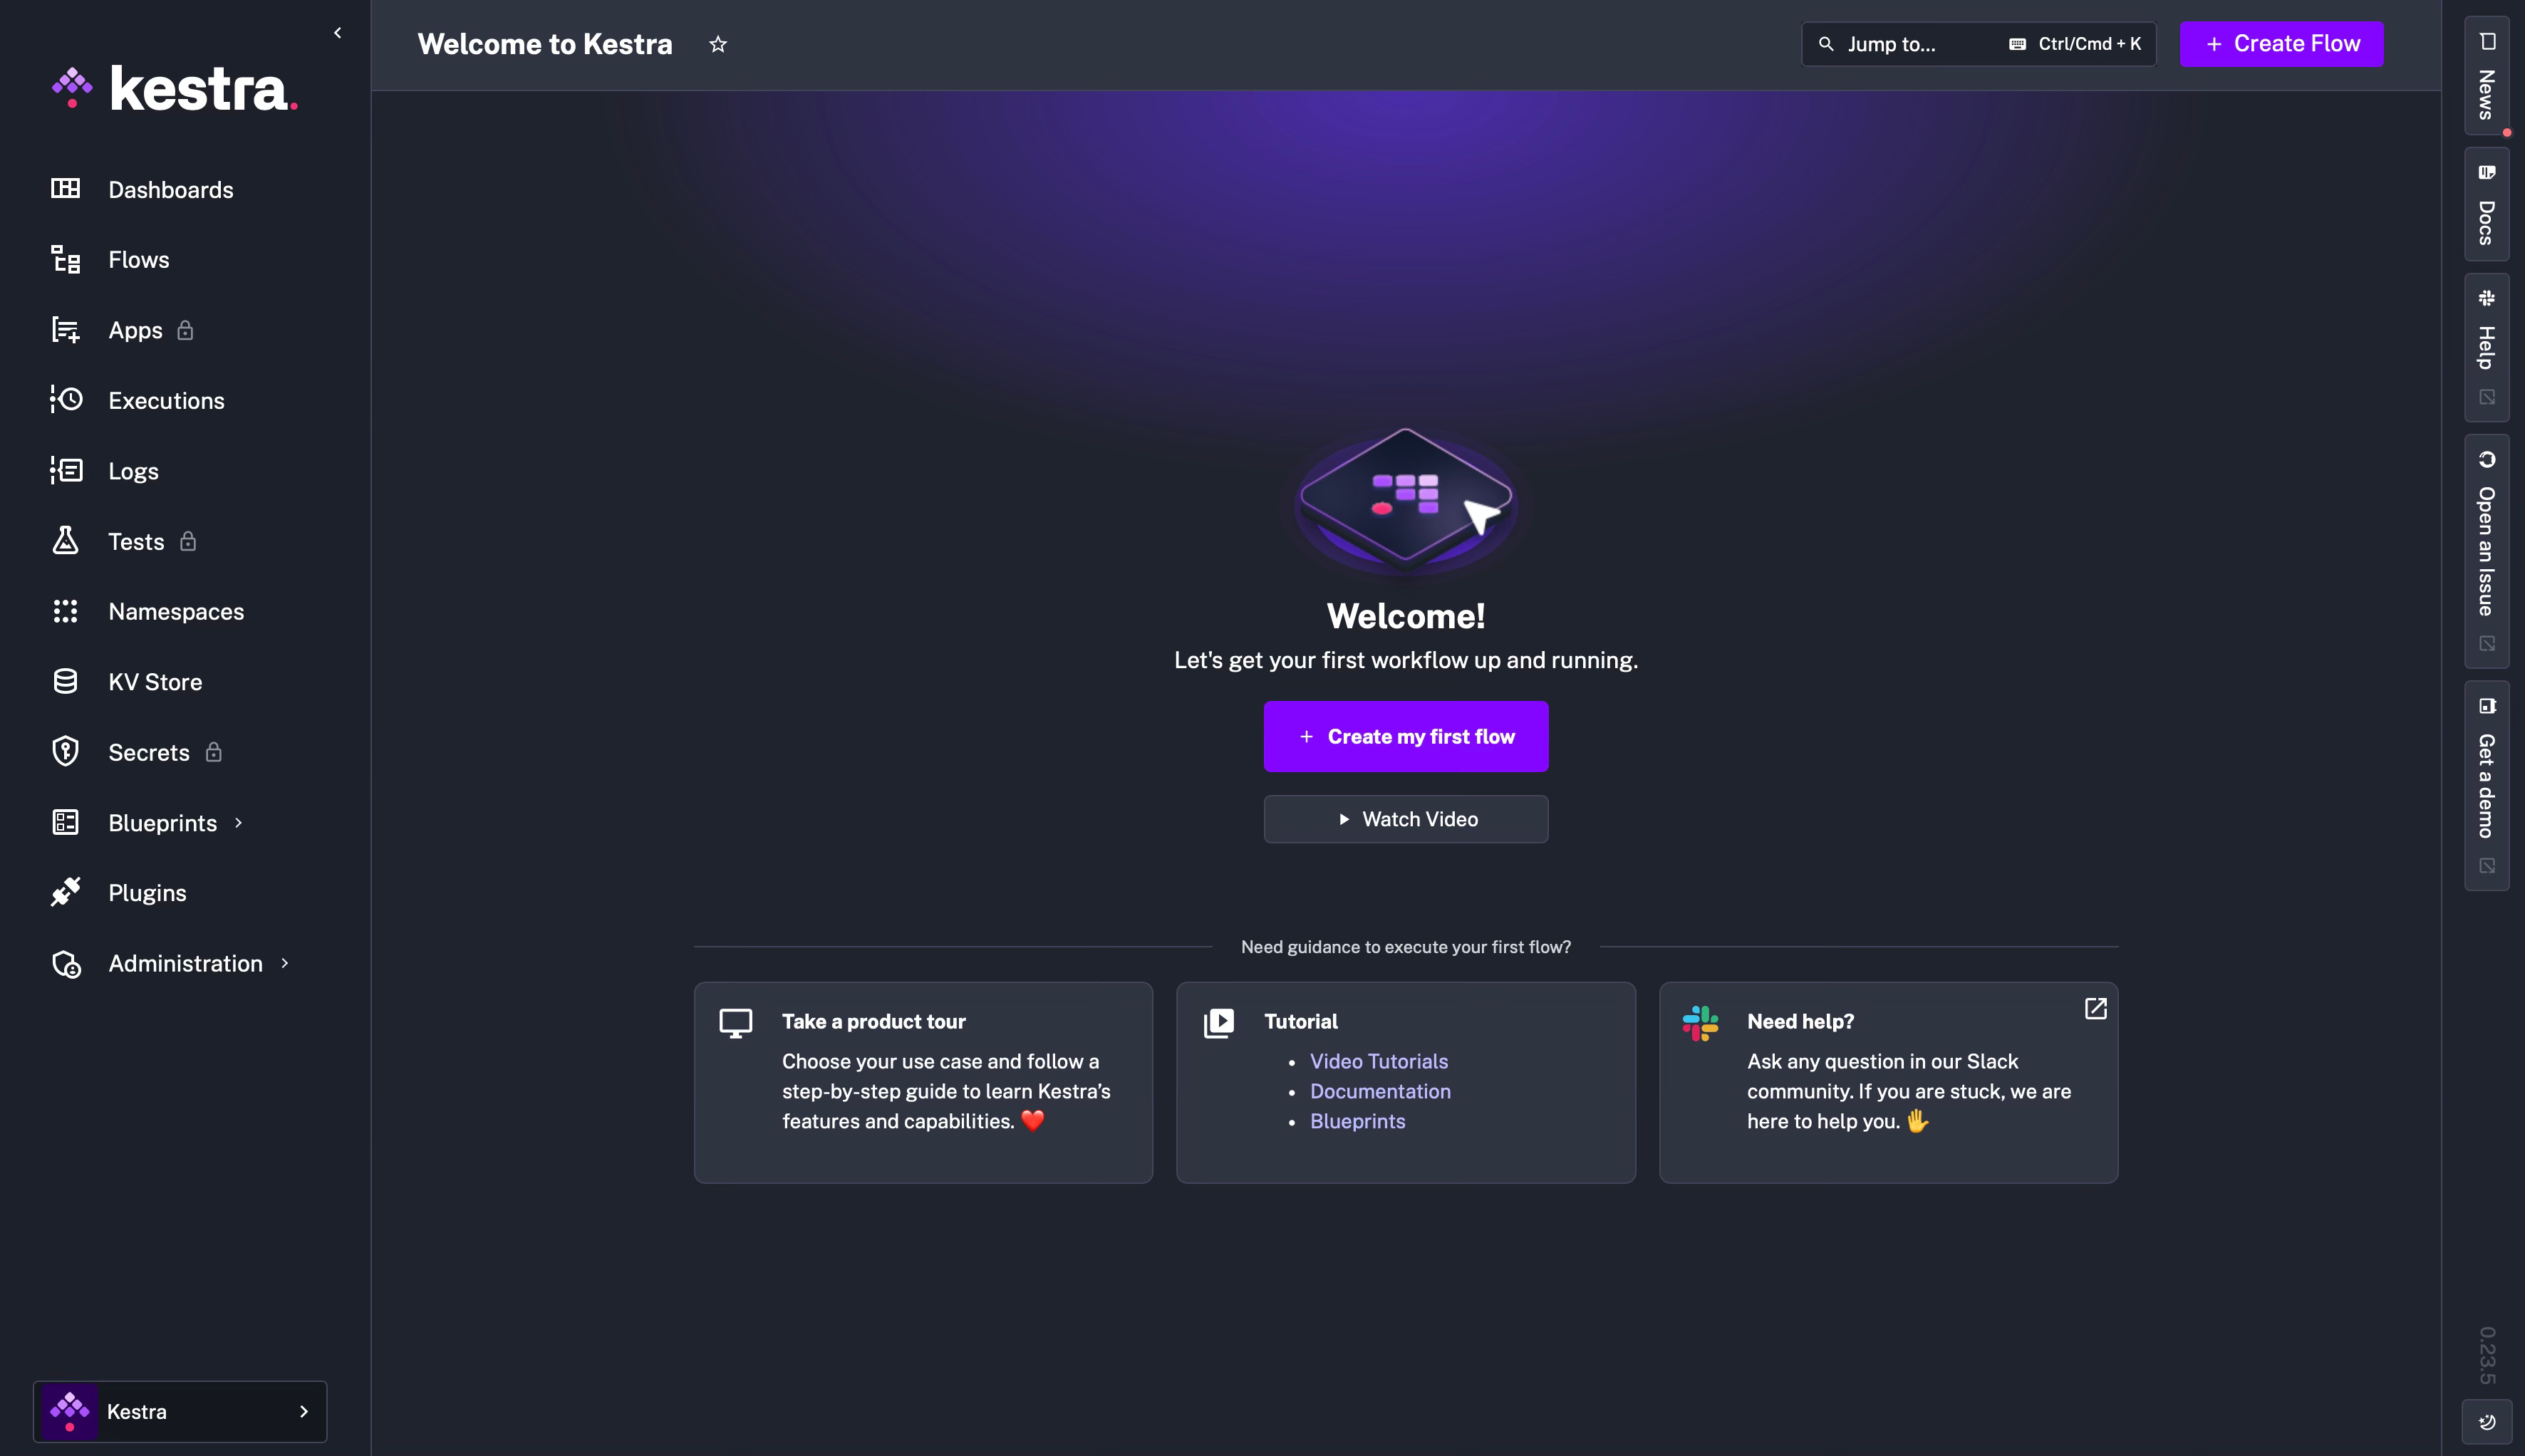
Brief app walk through
Until I create a Flow and execute it on the next step your dashboard and other pages will be empty, so I start off by clicking “Create Flow” and run the example Flow to collect some data on our pages.
The example Flow will look like the image below. I recommend also clicking Topology at the top navigation to show a diagram of the example flow:
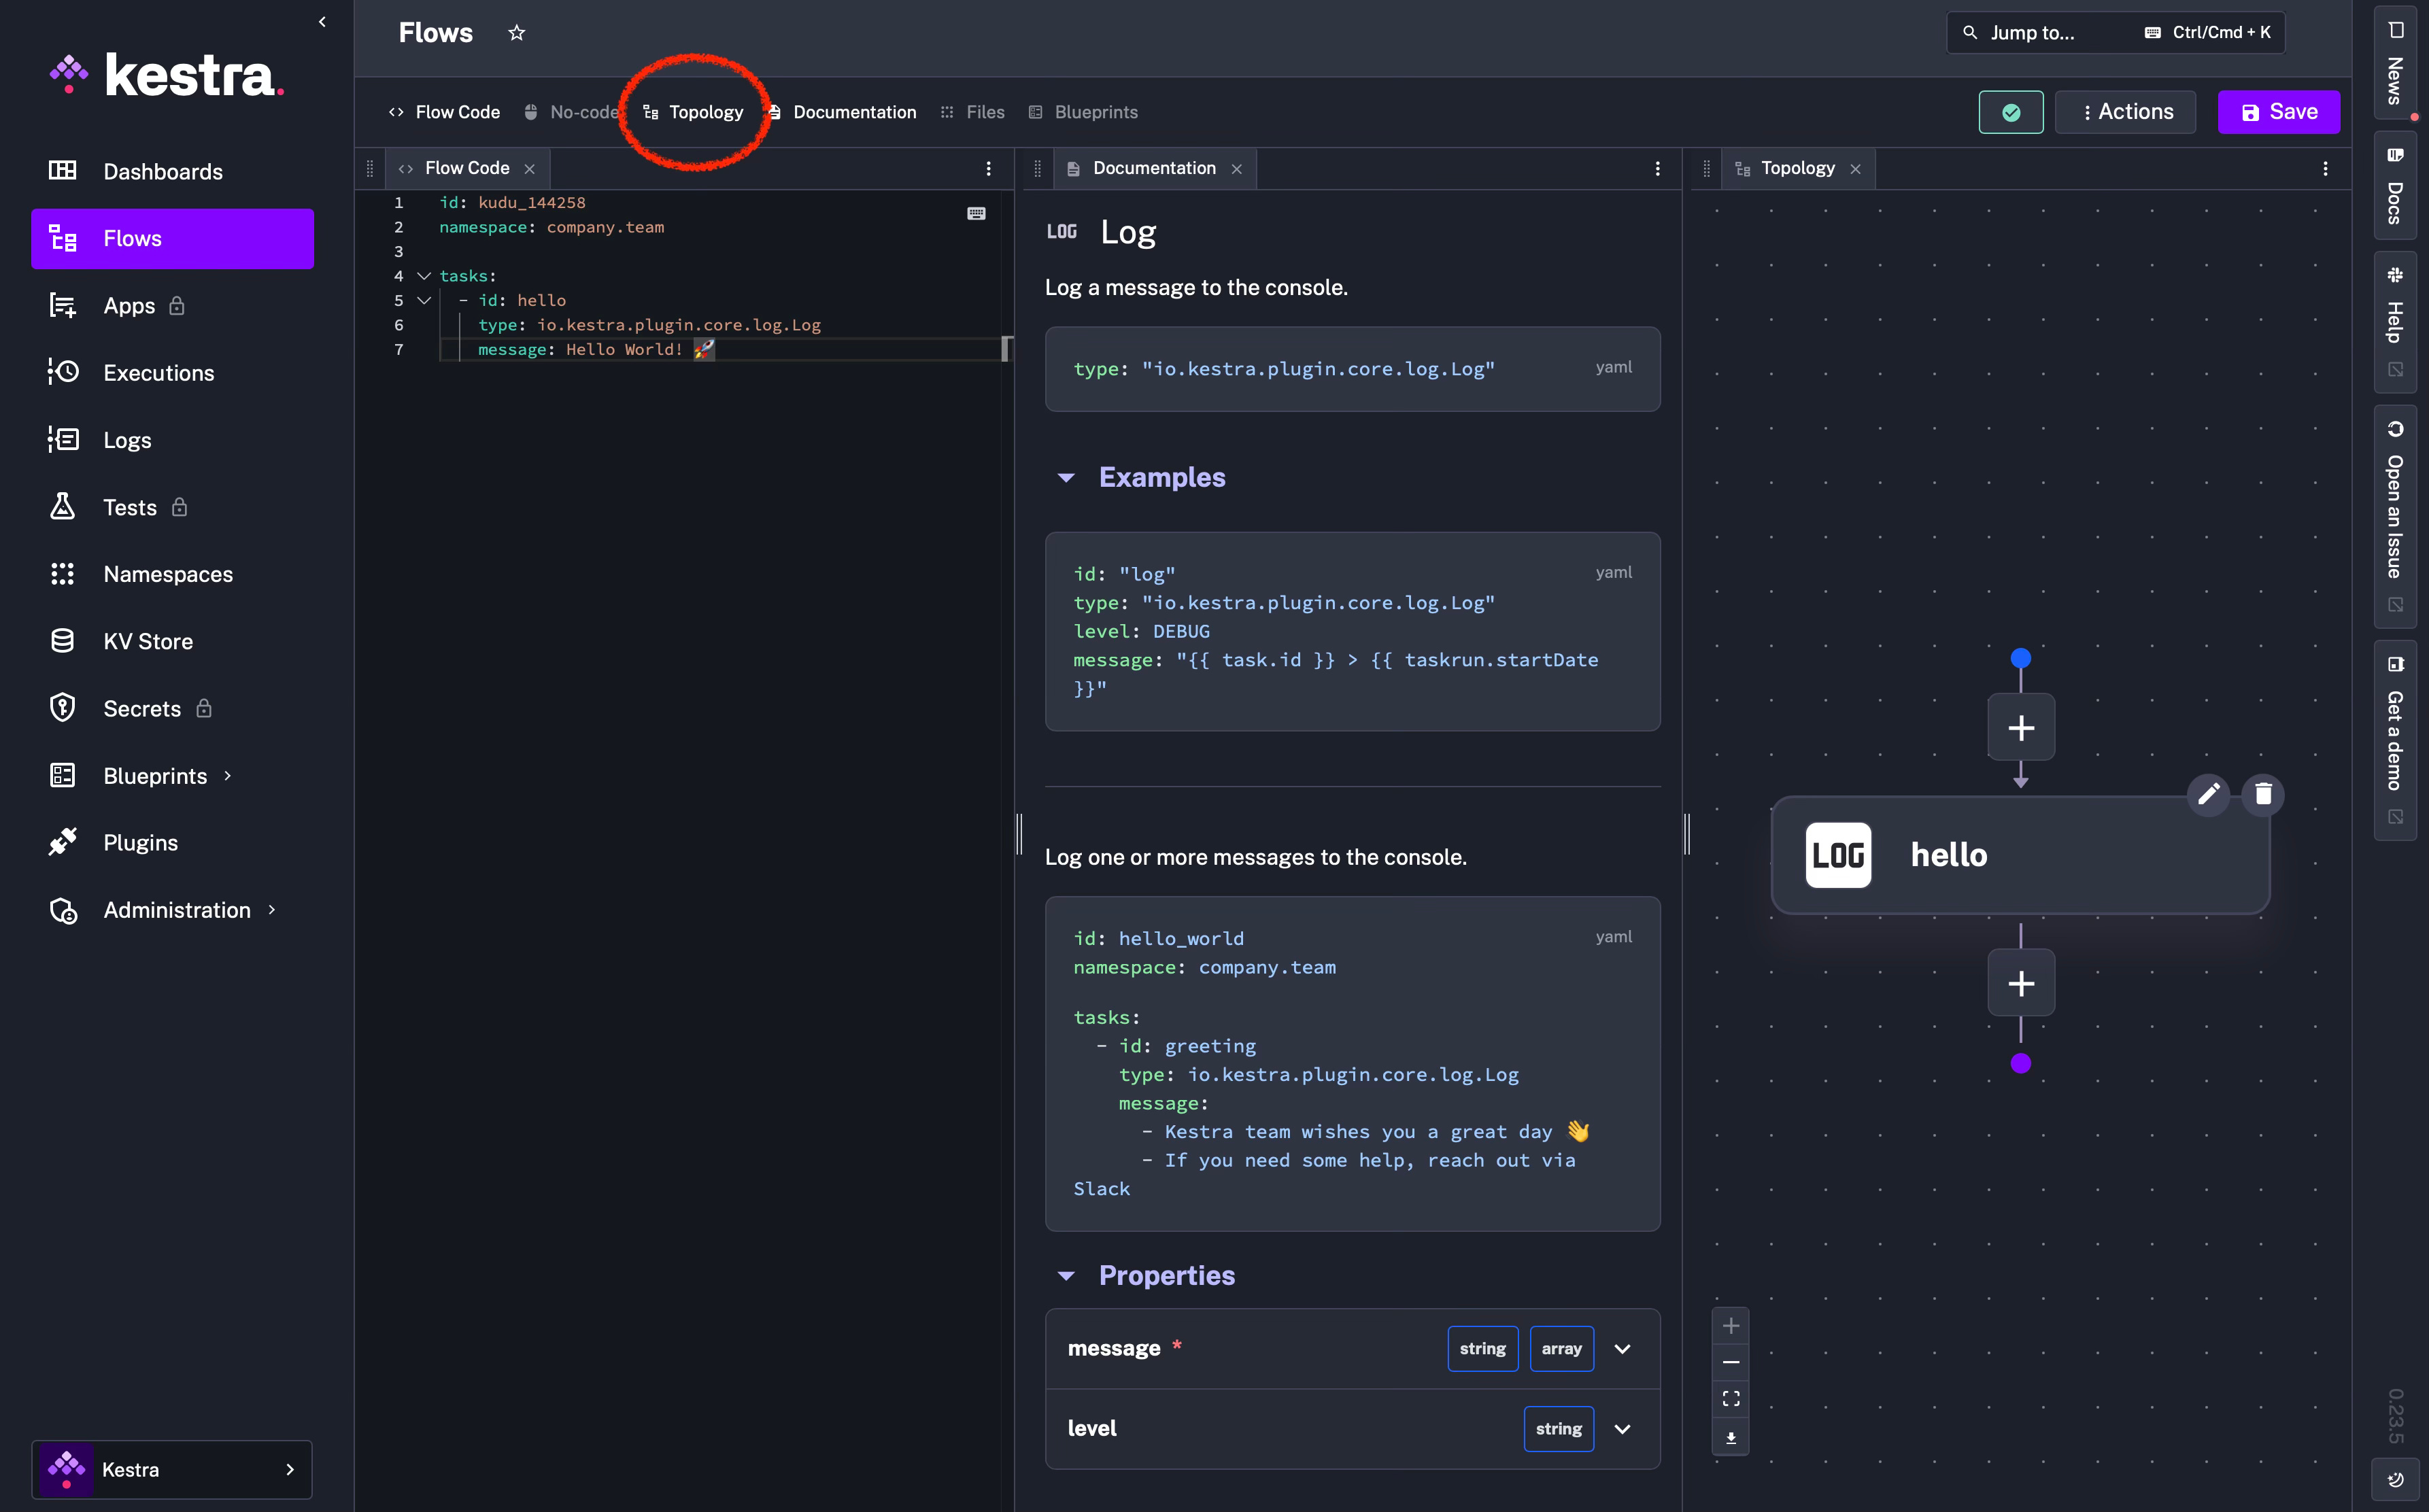
Click “Save” and then also click the “Execute” button that will appear above the save button. Once the Flow has been executed, you will be redirected to the Executions page and specifically to the execution for that flow.
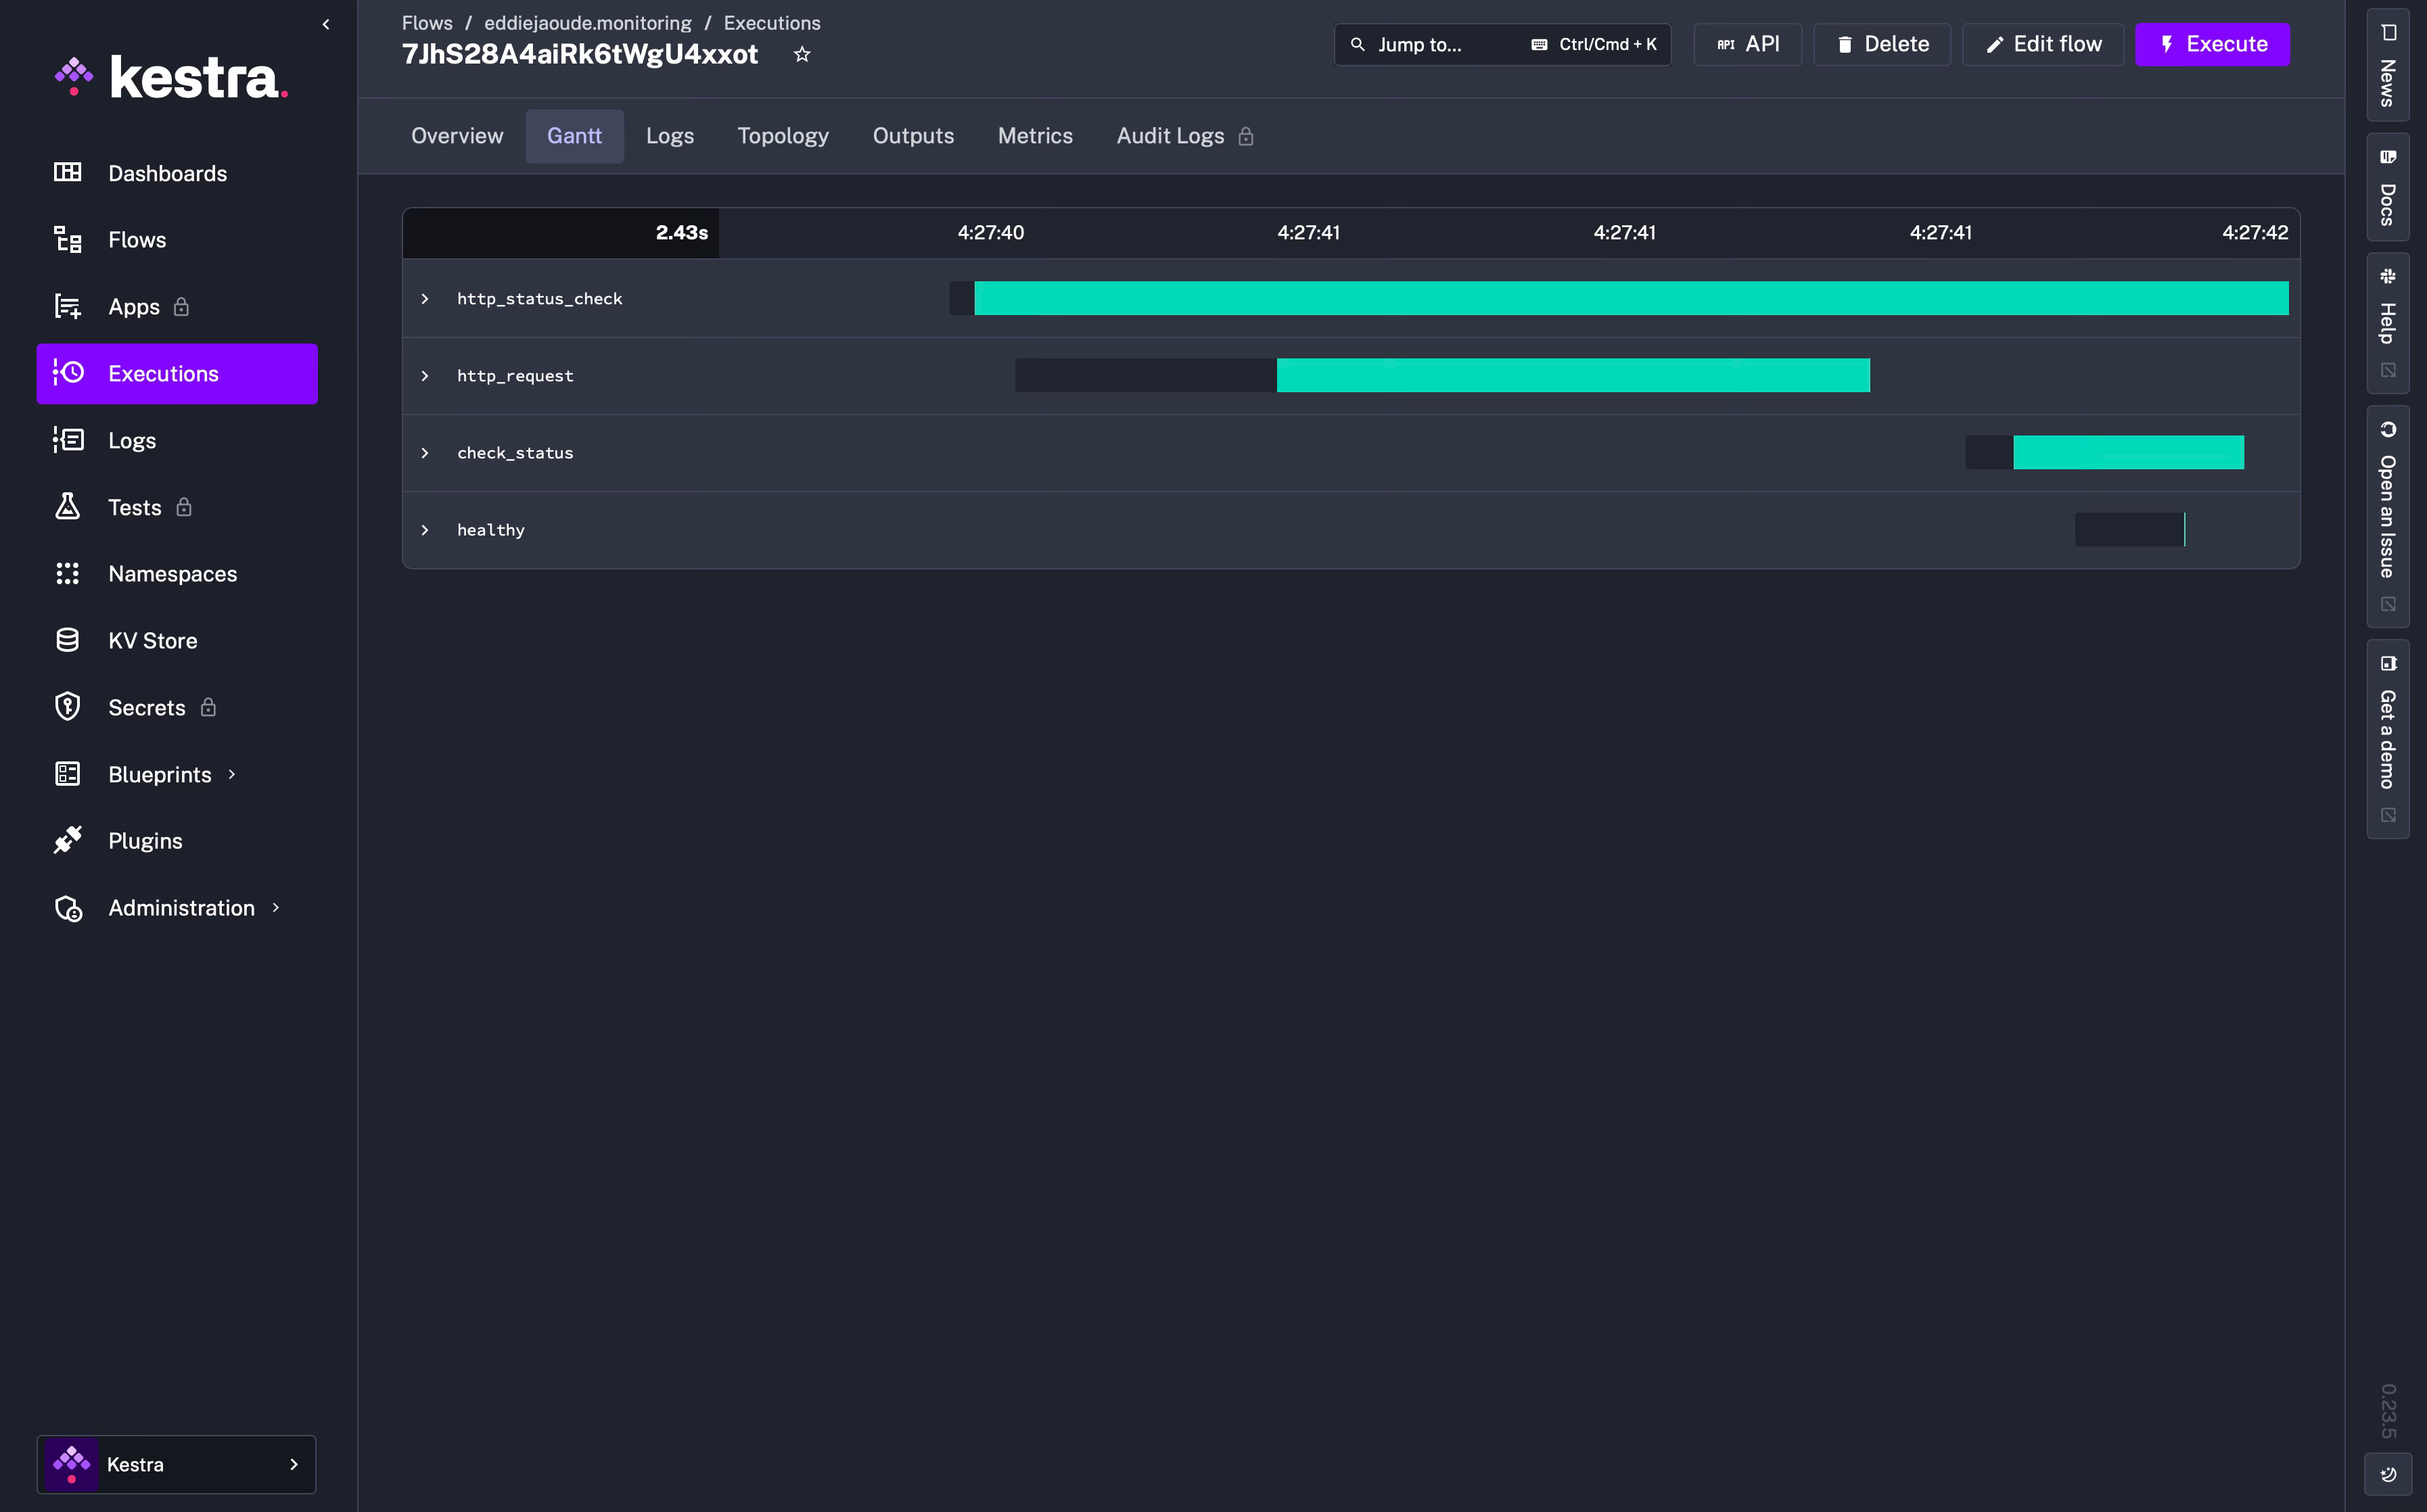
The default page in the Execution section is the “Gantt” diagram, which can be expanded:
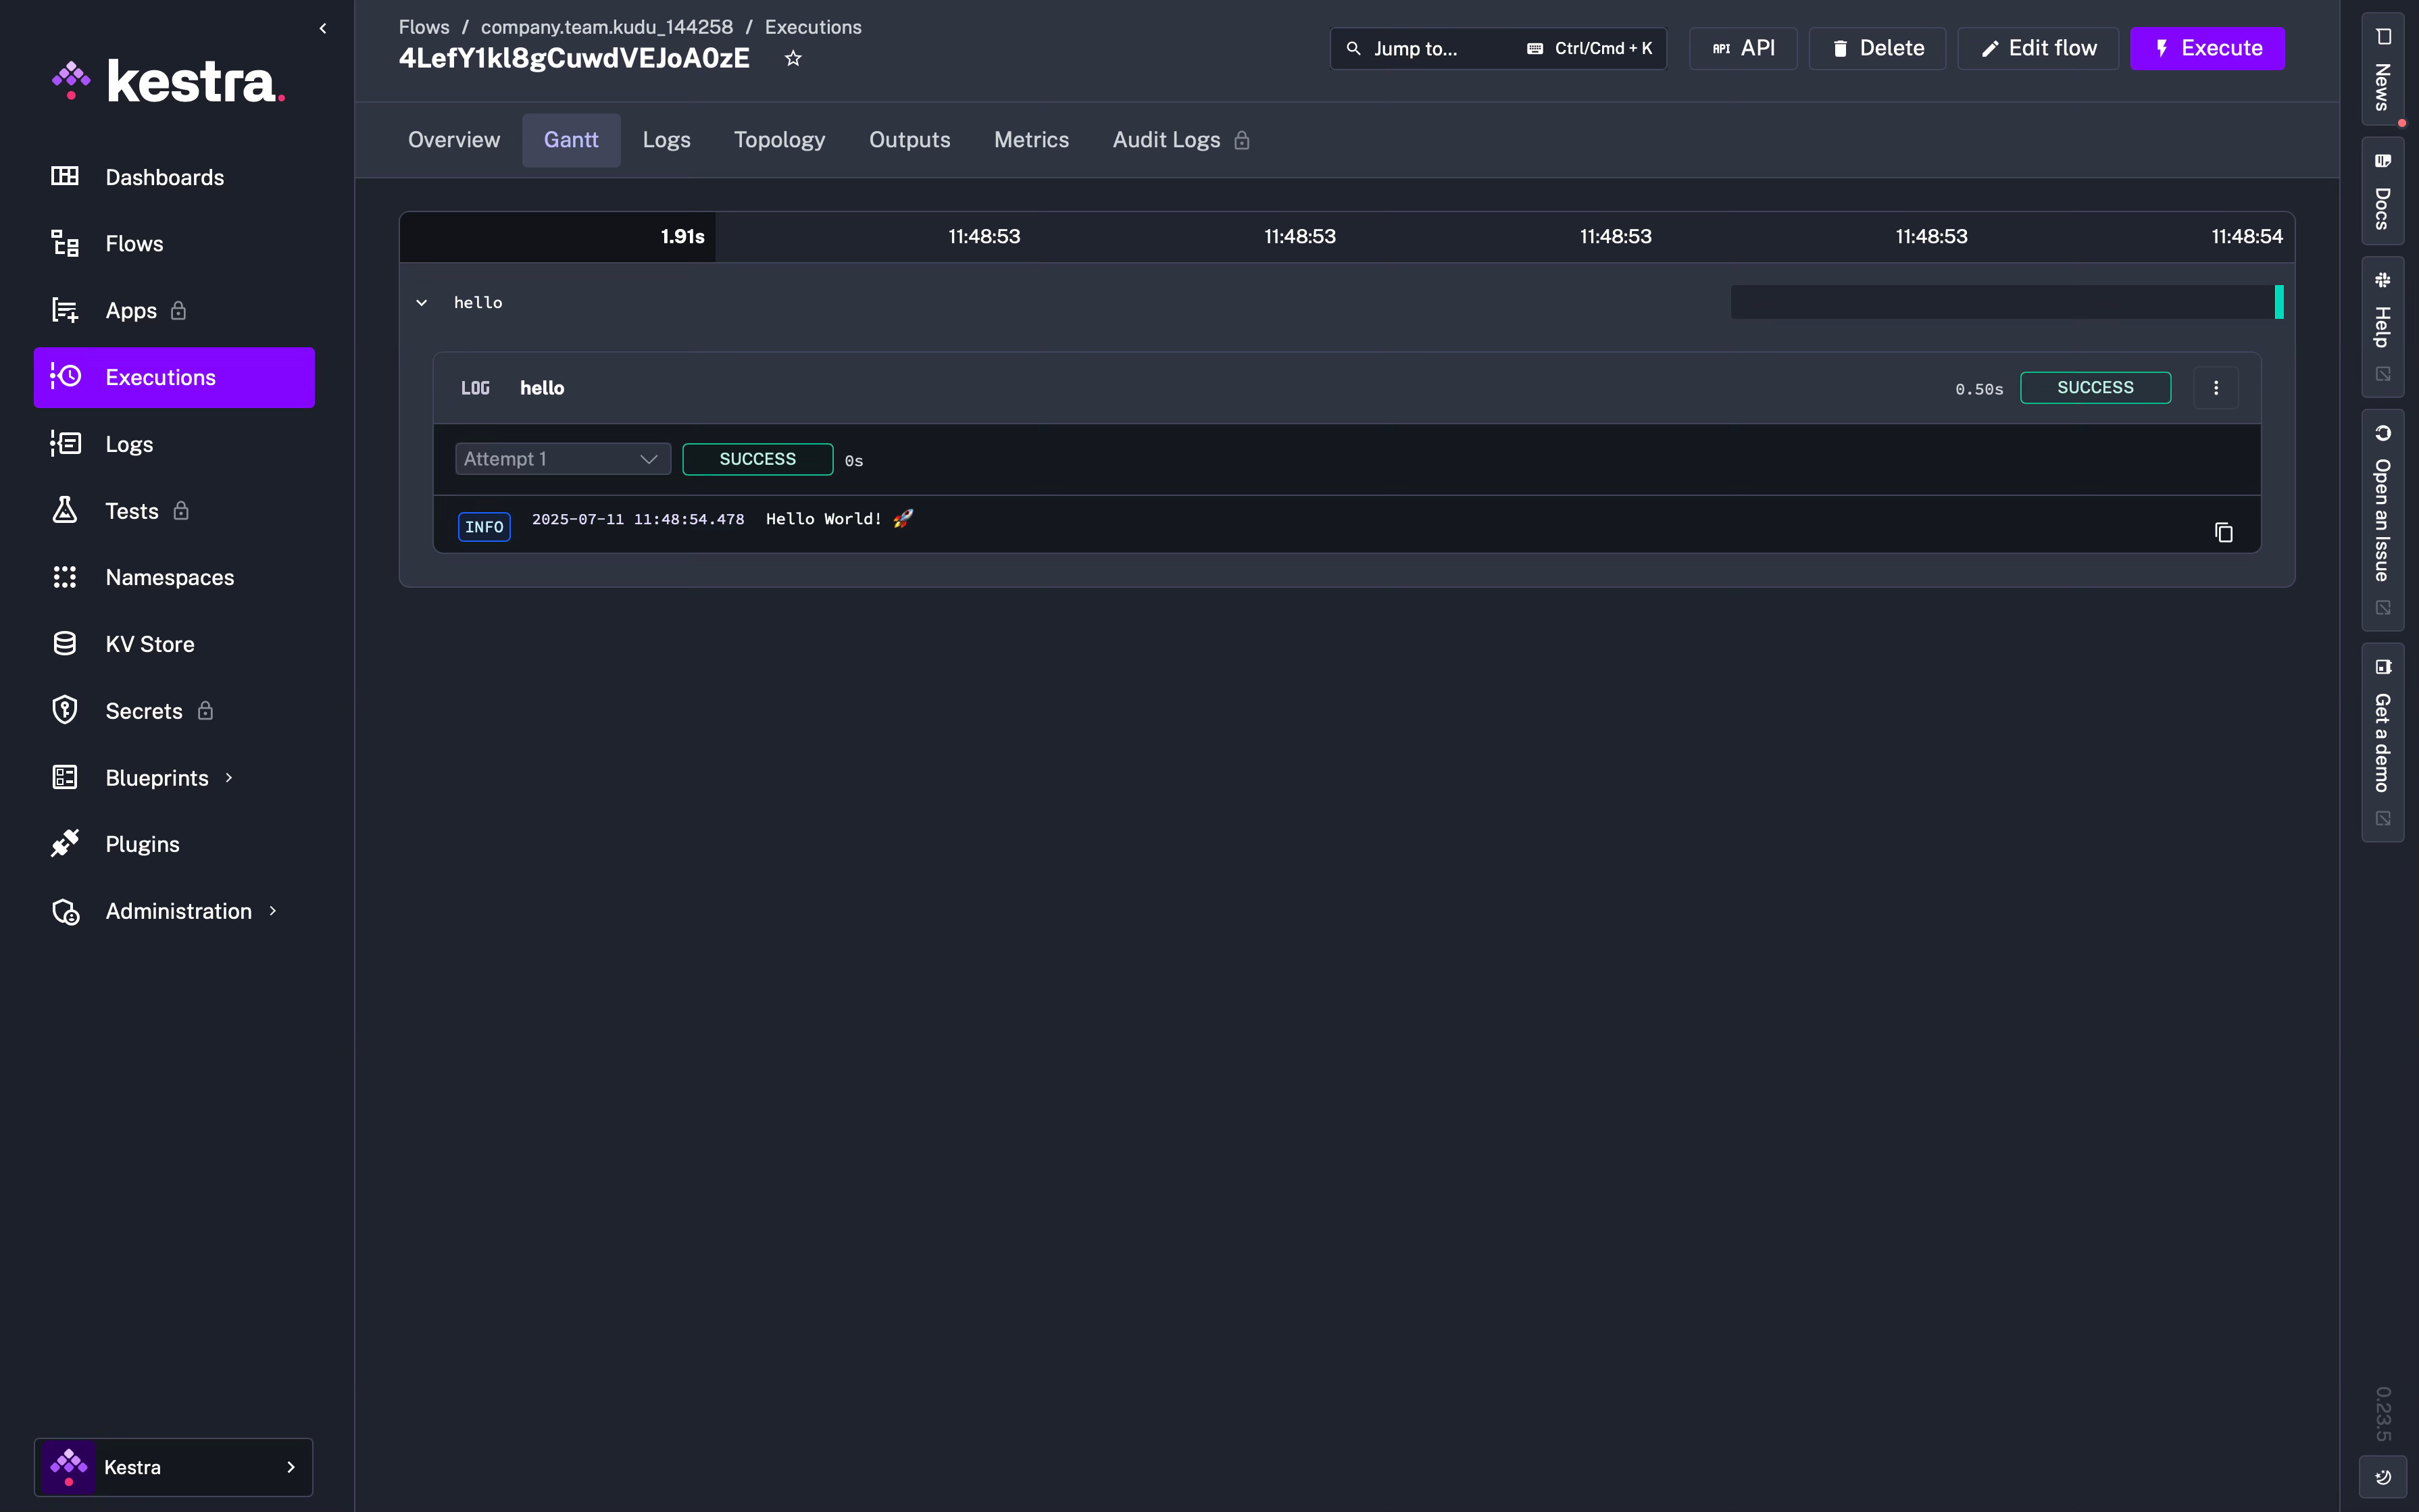
Navigation options at the top of the Execution:
The Execution page shows a list of all your completed flow executions. I am inside a specific execution and I am going to run through the menus that are available to give you a better understanding.
Overview
At the top there is a type of timeline where it has the created date of the Flow, the date of this execution of the Flow and also the success date and time.
Below in the table there is the Flow meta information: state, namespace, revision, labels, created and updated dates, duration and more useful information.
Gantt
The Gantt tab shows a Gantt diagram of each task duration and you can also replay a specific task in the flow, change the status and look at the metrics.
Logs
The Logs tab shows the Flow’s logs but it is possible to filter by log level as well as copy or download the logs.
Topology
The Topology tab - this has to be my favourite - is similar to the Editor view which shows a graphical representation of the Flow. Here you can also view the specific logs for a task or change the task status.
Outputs
The Output tab shows the Flow’s execution generated output. This is great to debugging.
Metrics
The Metrics tab shows every metric exposed by the tasks after the Flow’s execution. An example would be a loading data task might show the amount of files inputted, rows inserted and how long the operation took.
Navigation options down the left side:
Now that I have some data, albeit limited, I am going to go back to the main navigation.
Dashboard
This will show the default dashboard overview of my Kestra instance. You can create your own custom dashboards also. The overview information on the default dashboard includes: success ratio, failed ratio, running ratio, pending ration, as well as total executions and executions in progress and more.
Flows
Shows a list of all of your flows, from here you can create, edit and execute them. As well as a useful graph showing the total execution count and duration by date.
Executions
Displays a list of Flow executions where you can Restart, Kill, Pause, or Force Run. This can be done in bulk or navigate into a specific execution. Going into a specific execution I mentioned above.
Logs
On the logs page you will see the logs generated by all tasks. You can filter the results down by: namespace, Log level, Time Range, Start Date, End Date, Text.
Namespaces
Namespaces are great to group your Flows together as well as having the functionality to filter by a specific namespace and seeing the data associated with it.
KV Store
Kestra's workflows are stateless and this is by design. All workflow executions and task runs are isolated from each other by default to avoid any unintended side effects.
When you pass data between tasks, you do so explicitly by passing outputs from one task to another, and that data is stored transparently in Kestra's internal storage. This stateless execution model ensures that workflows are idempotent and can be executed anywhere in parallel at scale.
However, in certain scenarios, your workflow might need to share data beyond passing outputs from one task to another. For example, you might want to persist data across executions or even across different workflows. This is where the Key Value (KV) store comes into play. KV Store allows you to store any data in a convenient key-value format.
Blueprints
Blueprints are a curated, organized, and searchable catalog of ready-to-use examples designed to help you kickstart your workflow.
Each Blueprint combines code and documentation and can be assigned several tags for organization and discoverability.
All Blueprints are validated and documented. You can easily customize and integrate them into your new or existing flows with a single click on the "Use" button.
There are Blueprints for Flows and for Dashboards. Also there are Community Blueprints.
Plugins
Plugins are the building blocks of Kestra's tasks and triggers. I think of them like Lego building blocks. They encompass components interacting with external systems and performing the actual work in your flows. There are over 600 plugs at the moment and this is continually increasing.
Administration
This is where you can manage your Kestra Instance. For example: triggers, stats, workers, users, service accounts, roles etc.
Kestra Flow basics
So what does a Kestra config file look like? Well it is YAML and is really straightforward. Some properties are required, while others are optional.
Required properties
Every YAML file needs to have: an id, namespace and tasks. Whereas each task needs an id and type.
Here is a simple example:
id: basic_example
namespace: company.team

tasks:
  - id: hello_world
    type: io.kestra.plugin.core.log.Log
    message: Hello World!
There are two points I want you to keep in mind:
every id must be unique within a namespace, therefore “id” and “namespace” are the unique identifier for the flow.
the flow id and namespace cannot be changed once the Flow is created, this happens after the first save.
Description
This is optional but recommended for the Flow as well as each task.
Markdown is also allowed, here is an example:
description: |
  # Hello world
  Let's **start** - [My GitHub repo](https://github.com/kestra-io/kestra) 🚀
Labels
To add another layer of organisation, you can use labels, allowing you to group flows using key-value pairs. Labels are actually customisable tags to simplify monitoring and filtering of flows and executions.
Let me show you an example:
labels:
  group: github
  owner: eddiejaoude
Tasks
Tasks are atomic actions in your flows. I prefer to design my tasks to be small and granular, such as fetching data from a REST API or running a script. However, tasks can also represent large and complex processes as well.
By default tasks are in a YAML list and will be executed sequentially — the second task will start as soon as the first one finishes successfully.
It is possible to run tasks in parallel and also to allow failure of specific tasks. These kinds of actions are called Flowable tasks because they define the flow logic.
A task in Kestra must have an “id” and a “type” and other required or optional properties depend on the type of task.
Let me take you through these:
Task types
Core
Core tasks from the “io.kestra.plugin.core.flow” category are commonly used to control the flow logic. You can use them to declare which processes should run in parallel or sequentially.
Scripts
Script tasks are used to run scripts in Docker containers or local processes. You can use them to run Python, Node.js, or any other script.
Internal storage
Tasks from the “io.kestra.plugin.core.storage” category, along with Outputs, are used to interact with the internal storage. Kestra uses internal storage to pass data between tasks. You can think of internal storage as an S3 bucket. In fact, you can use your private S3 bucket as internal storage.
KV Store
Internal storage is mainly used to pass data within a single flow execution. If you need to pass data between different flow executions, you can use the KV Store. The tasks “Set”, “Get”, and “Delete” from the “io.kestra.plugin.core.kv” category allow you to persist data between executions (even across namespaces).
Tutorial on how to build the website monitoring flow
Taking into the account the above, I am now going to create my first real Flow. I will have my Kestra Flow check my website on a scheduler (cron) to make sure it is up and running, and if it is not, then it will create a GitHub Issue on our GitHub repo for me adding the label “bug”.
This is what the flow will look like and this diagram will be shown by Kestra:
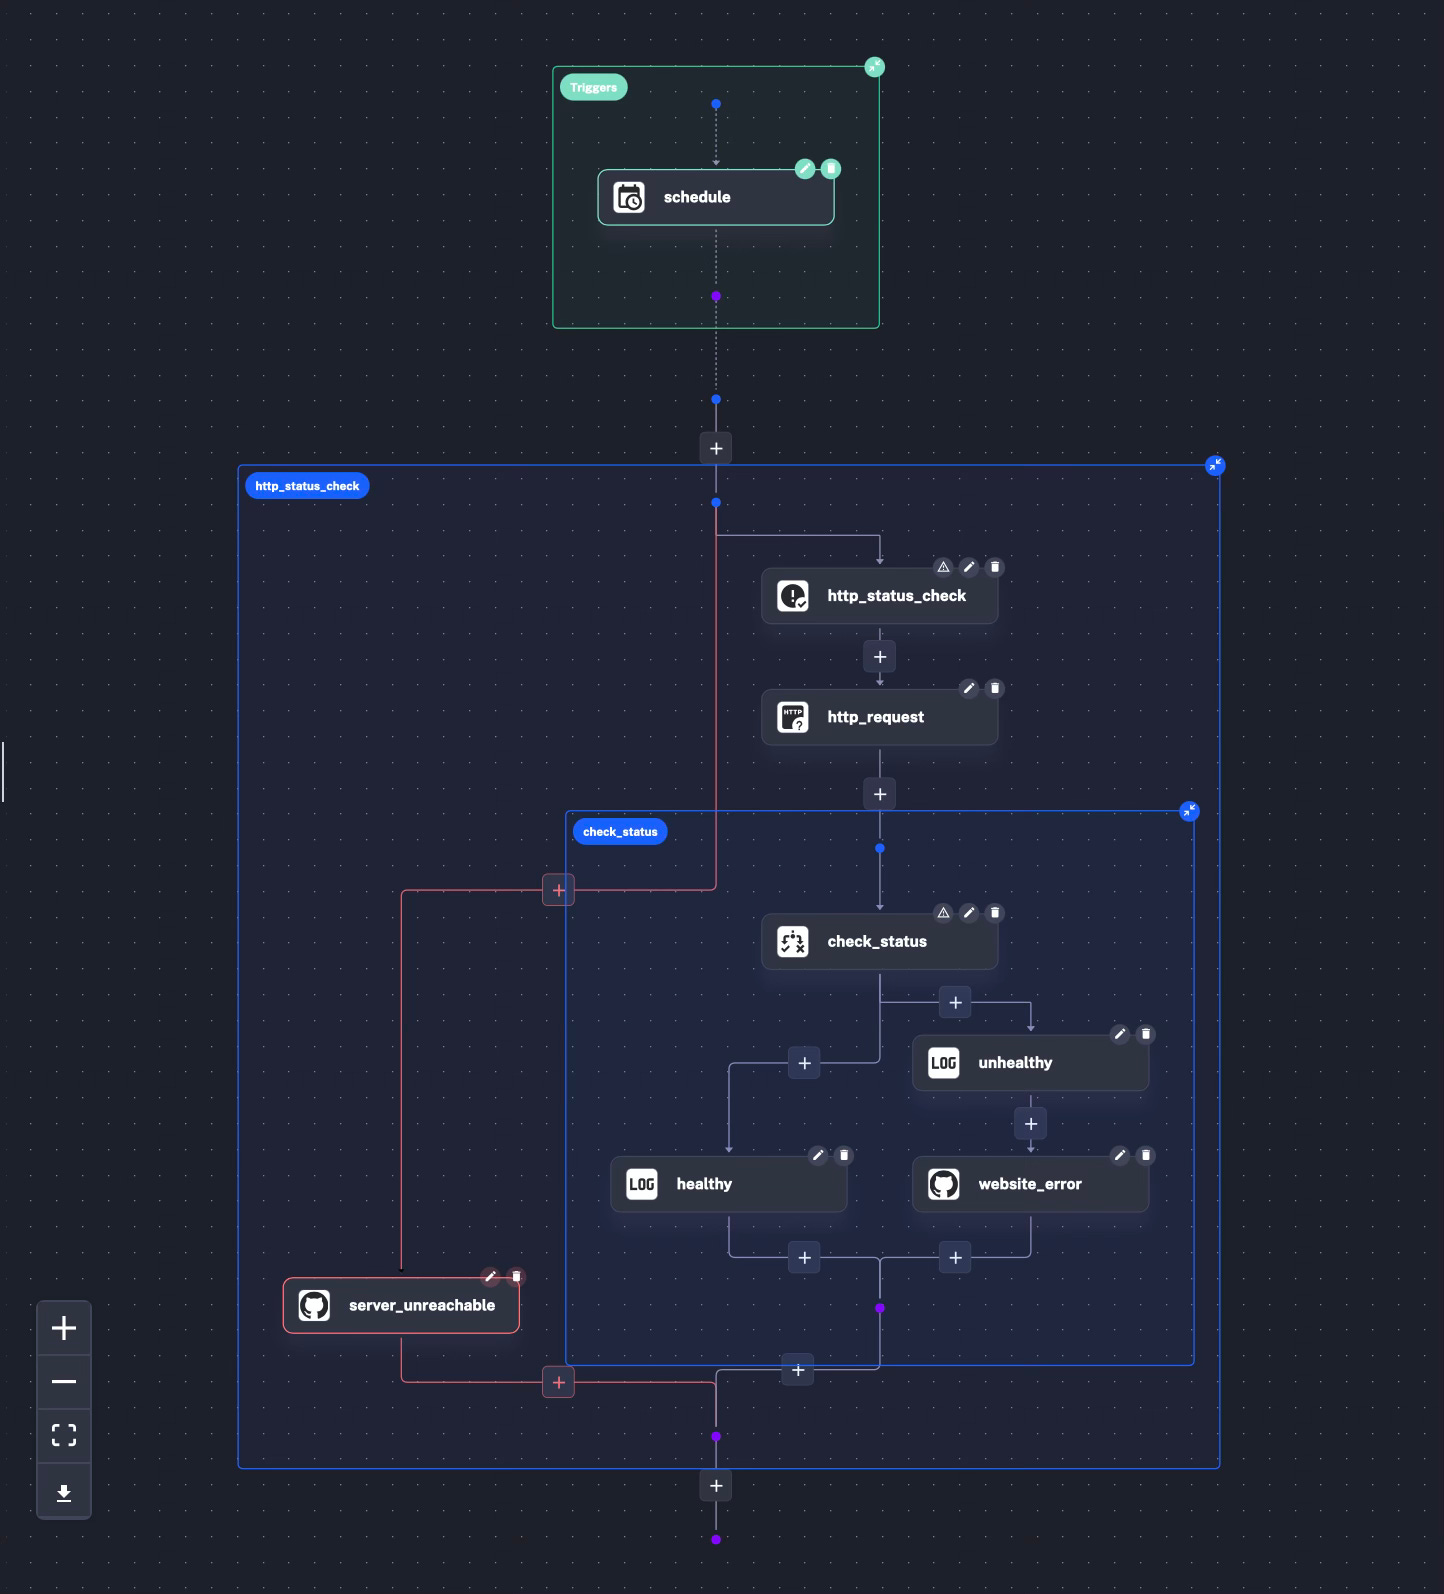
Let’s start from the beginning: I need an “id”, “namespace” and “description”:
id: monitoring
namespace: eddiejaoude
description: Ping url and raise GitHub issue on failure
So I don’t use strings in multiple places in our YAML Kestra Flow, I will use “inputs”, which will allow me to make our flows more dynamic and reusable.
Inputs are key-value pairs, where each “input” must have an “id” and “type”. It is also recommended to set “defaults”.
I will need 4 “inputs” for this flow: server uri, GitHub repo, GitHub user and GitHub token. This will go directly under the meta data I used above.
inputs:
  - id: server_uri
    type: URI
    defaults: https://eddiejaoude.io

  - id: github_repo
    type: STRING
    defaults: eddiejaoude/kestra-demo

  - id: github_user
    type: STRING
    defaults: eddiejaoude

  - id: github_token
    type: STRING
    defaults: github_pat_11AAEYQ6...
Ideally the GitHub token should be in a “secret” not as part of the Inputs, so it doesn’t get accidentally exposed as we should treat these like passwords. Kestra has a secrets functionality, but in the free Open Source version you need to add it to an environment variable rather than the dashboard. How you add the environment variable will depend on how you setup your instance.
Remember to restart your instance after you make config changes.
Now I can move on to my tasks. Instead of using a standard task list, I will wrap the tasks in an “AllowFailure”. This will allow a task to fail without stopping the execution of the downstream tasks in the flow.
For example if a child task of “AllowFailure” task fails, the flow will stop executing this specific block of tasks, but the flow of execution of tasks will continue.
tasks:
  - id: http_status_check
    type: io.kestra.plugin.core.flow.AllowFailure

    errors:
      - id: server_unreachable
        type: io.kestra.plugin.github.issues.Create
        login: "{{ inputs.github_user }}"
        oauthToken: "{{ inputs.github_token }}"
        repository: "{{ inputs.github_repo }}"
        title: Server unreachable
        body: "{{ execution.id }} has failed on {{ taskrun.startDate }}. See the link below for more details"
        labels:
          - bug

    tasks: ...
I have given it an “id” and “type” of “io.kestra.plugin.core.flow.AllowFailure” followed by “errors”. Here I can have multiple actions, but I only have one which is using the Kestra Plugin “io.kestra.plugin.github.issues.Create” to create a GitHub Issue if an error occurs.
You will notice that some of the error task properties have strings with “{{ }}”, this is for me to use the “inputs” and at run time the values I defined earlier.
In the sub tasks I will make the http request and then check the result in a condition. The first nested task will be to make the http request and I can do this with the type using the core Kestra “Request” plugin:
      - id: http_request
        type: io.kestra.plugin.core.http.Request
        uri: "{{ inputs.server_uri }}"
Next task in this nested task list will be to check the status of the http request, where I can use the core plugin “If” and the “outputs” from the previous task using the id. This is why it is important to use meaningful “id”s for tasks, because we often use them later on.
In the “if” task I use the property “condition” to check the http response status code of 200. The other 2 properties I will use are “then” and “else”.
“then” will be triggered if the condition is matched
“else” will be triggered if the condition is not matched
It is possible to have multiple tasks in each situation, you will see in the “else” there is only 1 task but in the “then” there are 2 tasks.
      - id: check_status
        type: io.kestra.plugin.core.flow.If
        condition: "{{ outputs.http_request.code != 200 }}"
        then:
          - id: unhealthy
            type: io.kestra.plugin.core.log.Log
            message: Server is unhealthy! Response {{ outputs.http_request.body }}

          - id: website_error
            type: io.kestra.plugin.github.issues.Create
            login: "{{ inputs.github_user }}"
            oauthToken: "{{ inputs.github_token }}"
            repository: "{{ inputs.github_repo }}"
            title: Website is down
            body: "The server {{ inputs.server_uri }} is down!"
            labels:
              - bug
        else:
          - id: healthy
            type: io.kestra.plugin.core.log.Log
            message: Everything is fine!
Both situations have a task for logging the condition using Kestra’s core plugin “Log”, in the “then” condition there is a second task which is similar to error task earlier which uses the GitHub plugin to create an issue.
Putting this all together, you should have this:
id: monitoring
namespace: eddiejaoude
description: Ping url and raise GitHub issue on failure

inputs:
  - id: server_uri
    type: URI
    defaults: https://eddiejaoude.io

  - id: github_repo
    type: STRING
    defaults: eddiejaoude/kestra-demo

  - id: github_user
    type: STRING
    defaults: eddiejaoude

  - id: github_token
    type: STRING
    defaults: github_pat_...

tasks:
  - id: http_status_check
    type: io.kestra.plugin.core.flow.AllowFailure
    tasks:
      - id: http_request
        type: io.kestra.plugin.core.http.Request
        uri: "{{ inputs.server_uri }}"

      - id: check_status
        type: io.kestra.plugin.core.flow.If
        condition: "{{ outputs.http_request.code != 201 }}"
        then:
          - id: unhealthy
            type: io.kestra.plugin.core.log.Log
            message: Server is unhealthy! Response {{ outputs.http_request.body }}

          - id: website_error
            type: io.kestra.plugin.github.issues.Create
            login: "{{ inputs.github_user }}"
            oauthToken: "{{ inputs.github_token }}"
            repository: "{{ inputs.github_repo }}"
            title: Website is down
            body: "The server {{ inputs.server_uri }} is down!"
            labels:
              - bug
        else:
          - id: healthy
            type: io.kestra.plugin.core.log.Log
            message: Everything is fine!

    errors:
      - id: server_unreachable
        type: io.kestra.plugin.github.issues.Create
        login: "{{ inputs.github_user }}"
        oauthToken: "{{ inputs.github_token }}"
        repository: "{{ inputs.github_repo }}"
        title: Server unreachable
        body: "{{ execution.id }} has failed on {{ taskrun.startDate }}. See the link below for more details"
        labels:
          - bug
Which will look like this:
Next press “save” and then “execute”:
I don’t want to do that every 5 or 15 minutes myself, so I can press “edit” and add a “trigger” with the type using the Kestra core plugin “Schedule” to our YAML config.
The “cron” property should look familiar to the linux crontab:
triggers:
- id: schedule
type: io.kestra.plugin.core.trigger.Schedule
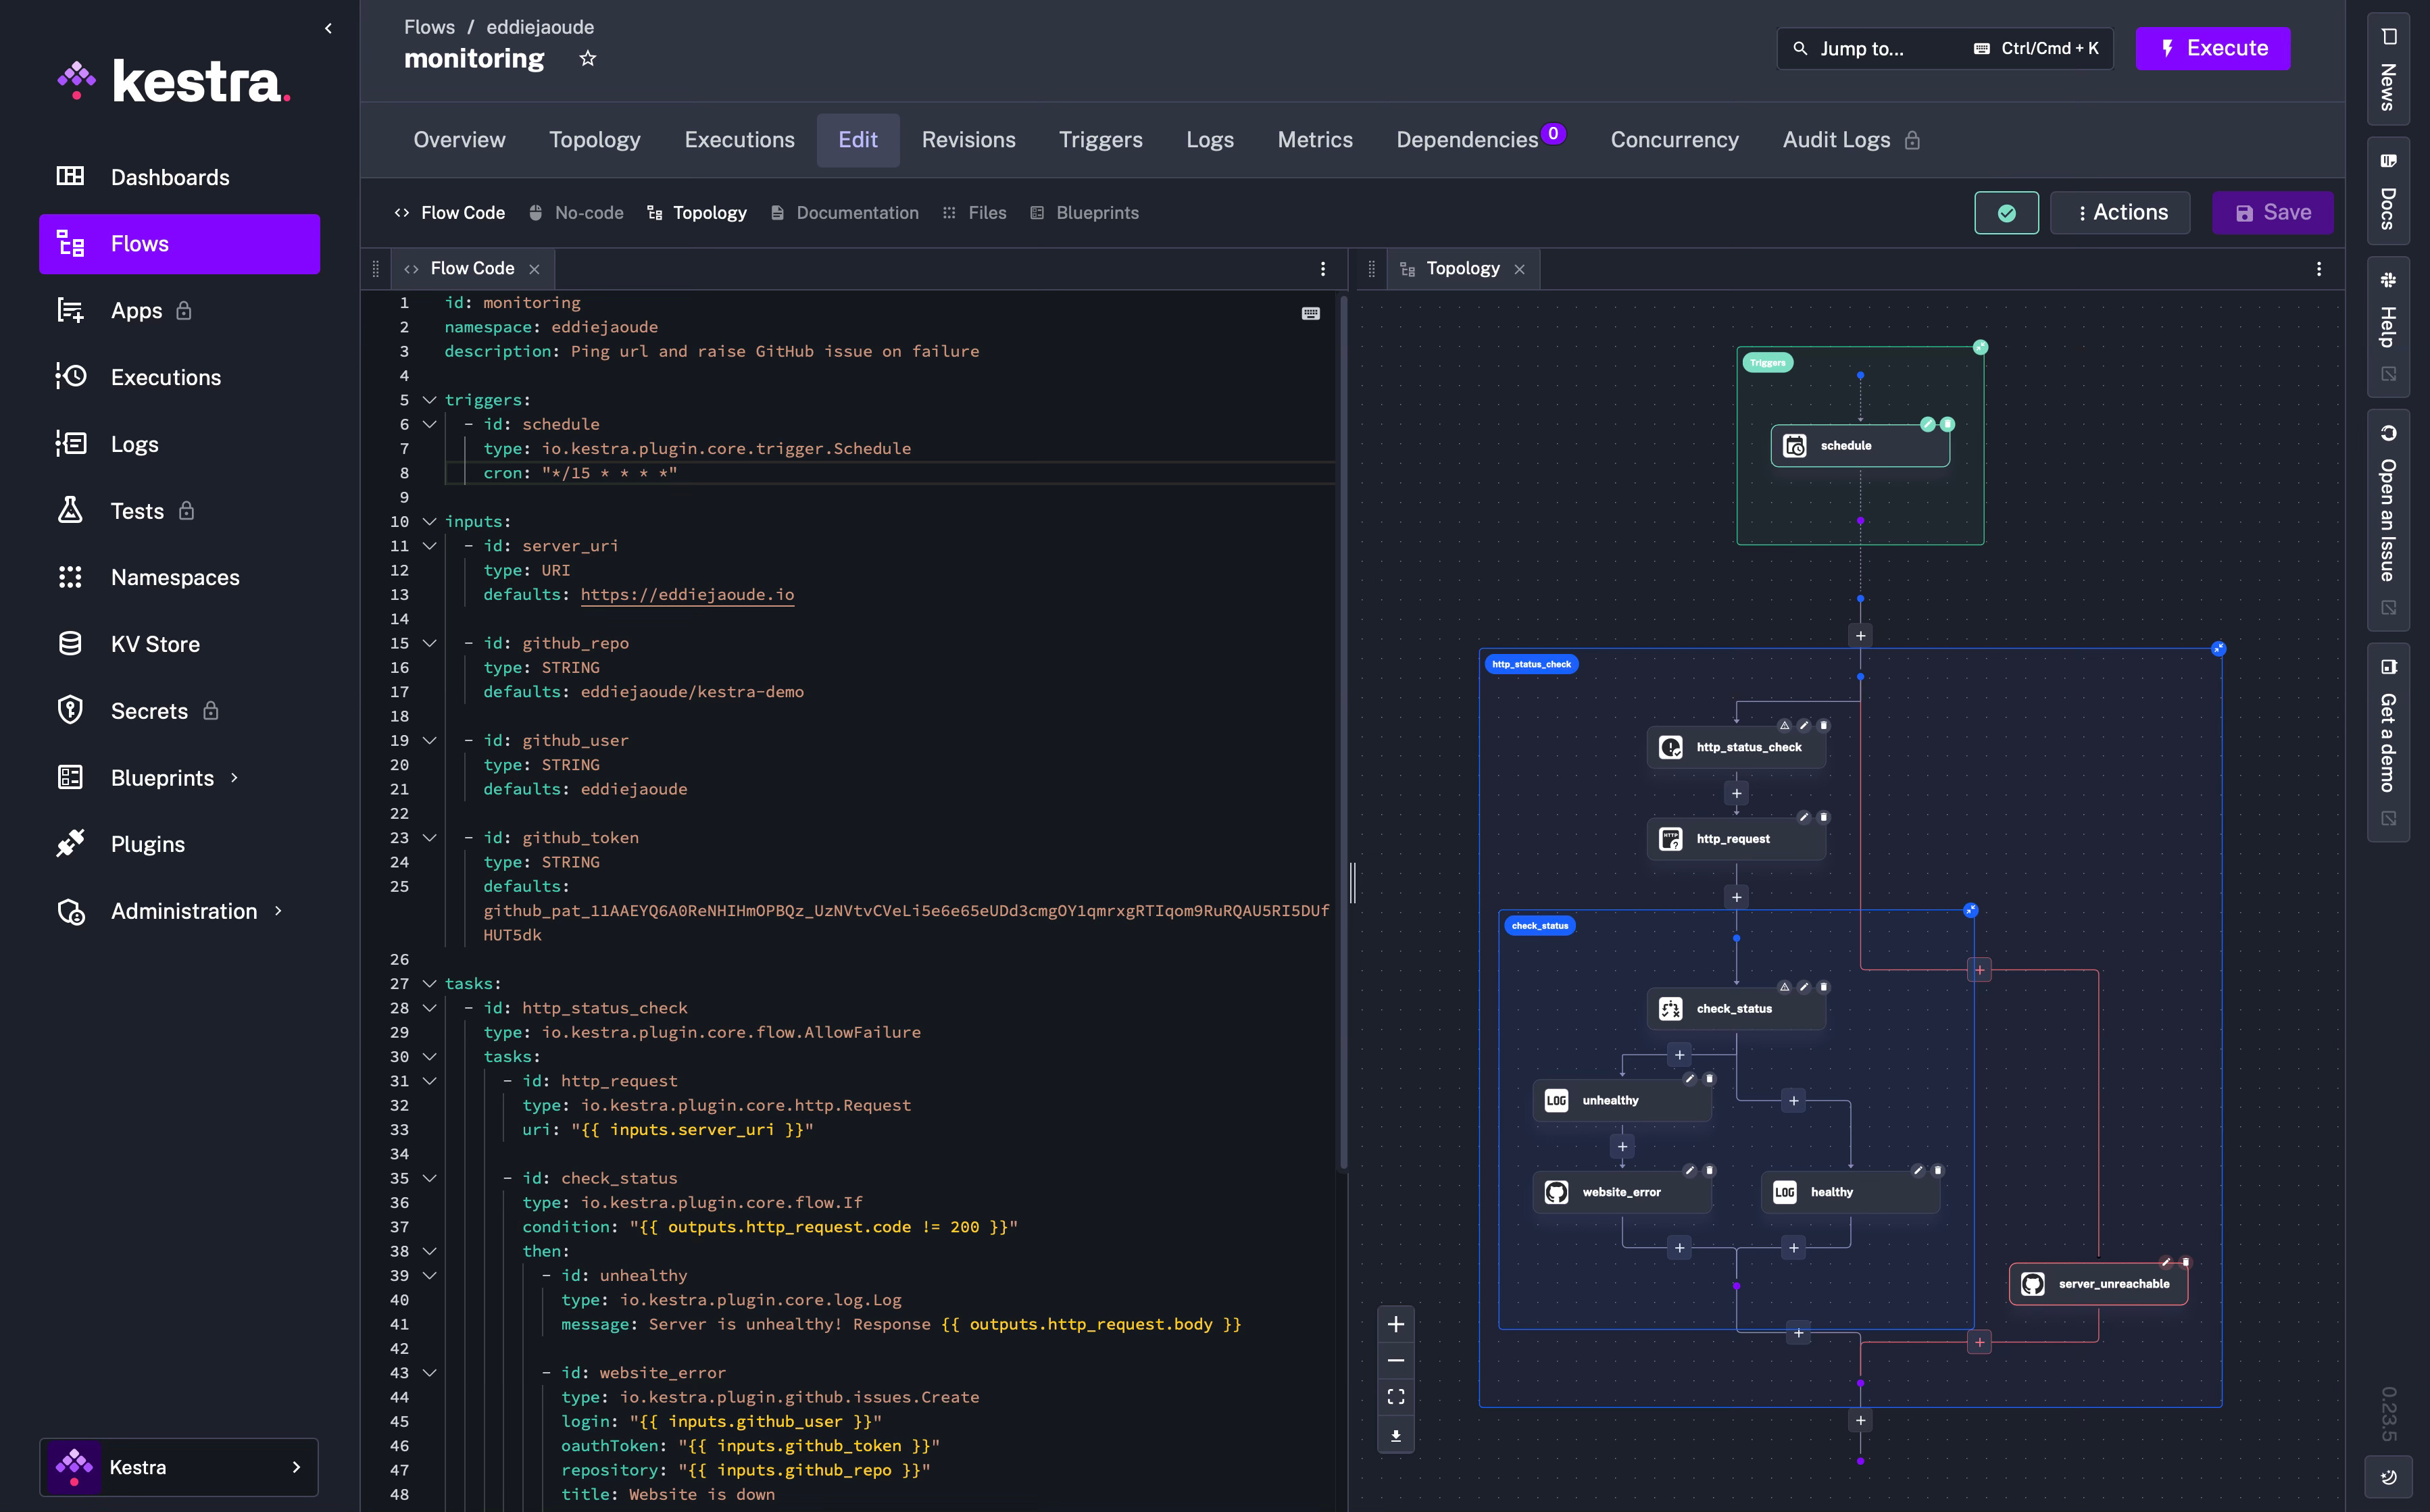
cron: "*/15 * * * *"I really like how Kestra updates the diagram with the trigger at the top of the flow:
I leave that running to collect some data. If you would like to see it fail, you could change the expected status code, just to make sure a GitHub Issue is created.
After running for multiple hours
After several hours it is time to look at the Kestra instance. What you will see is that most pages now have more interesting data; the dashboard, the logs and the executions page. Now that there is more data and I recommend going back and explore the various pages again.
A good place to start is the Execution page:
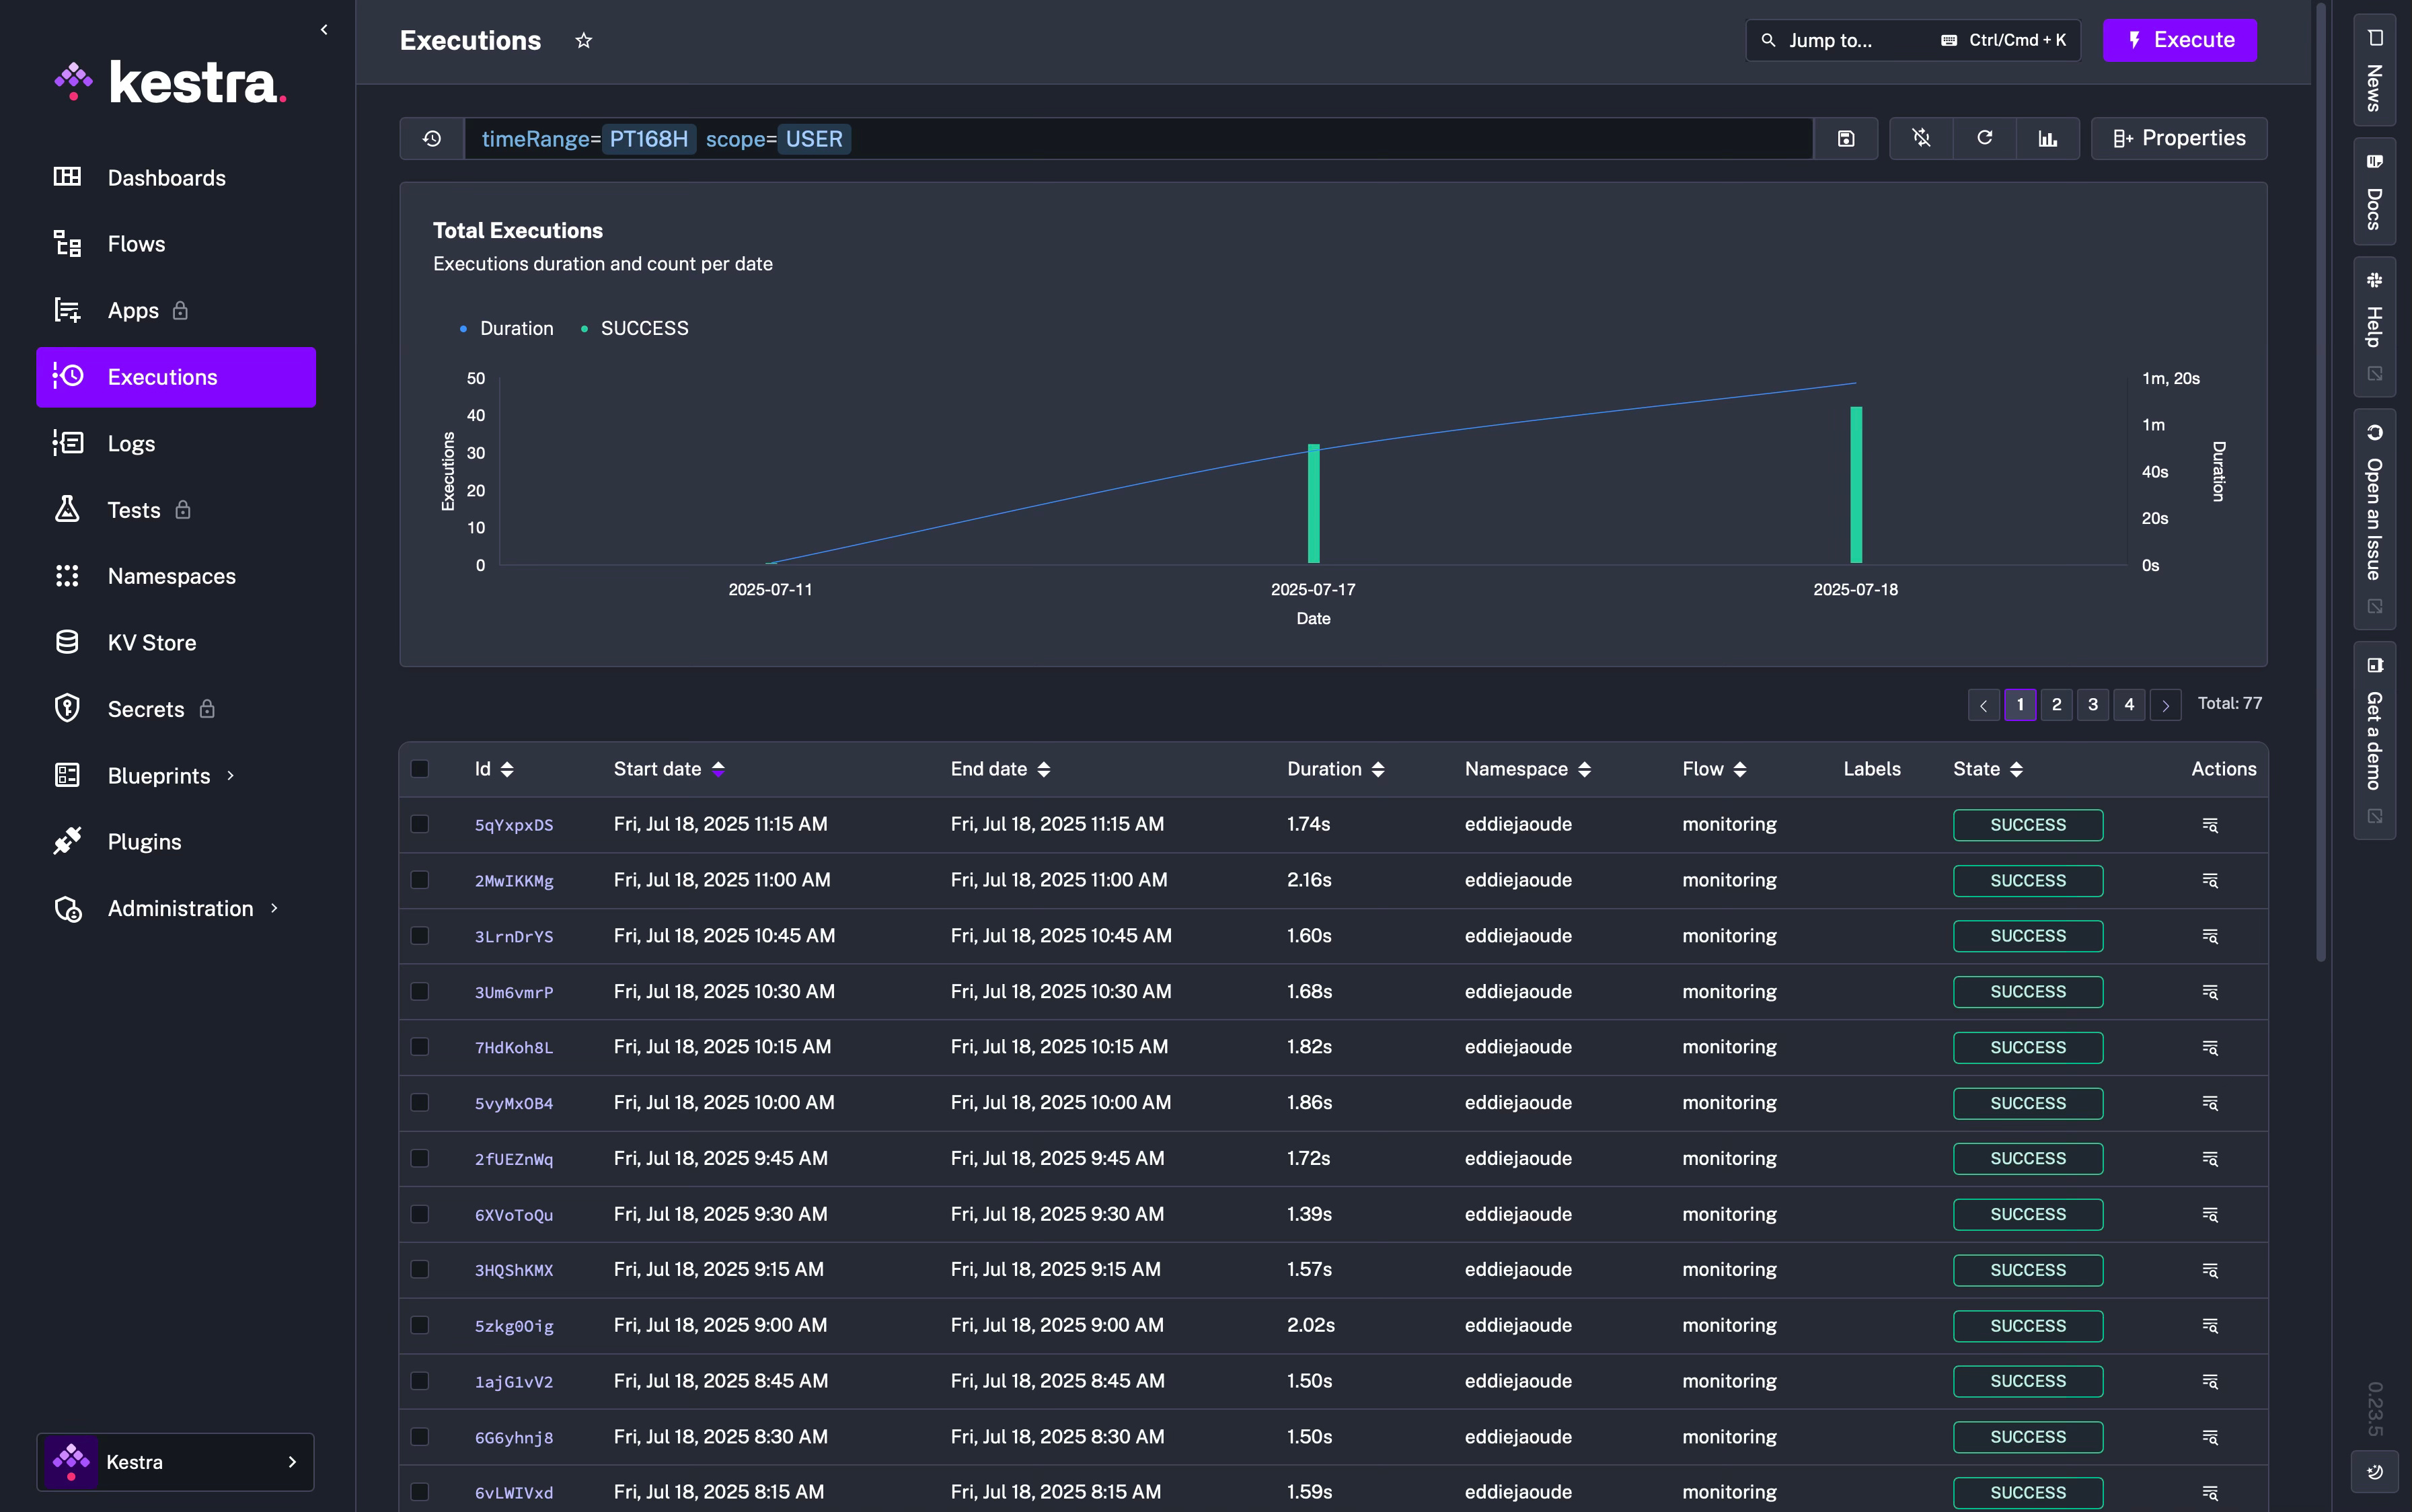
Navigation options down the right side:
If you get stuck or you wish to keep up with the latest Kestra updates there are useful navigation buttons I really think are worth bringing to your attention.
News
This button opens the right panel to the latest Kestra news, where you can learn more about this project, such as its latest features.
Docs
If you have read my blog you know how important I think documentation is. You can have the documentation available right in your Kestra Instance and navigate further or search for the documentation you need.
Help
This opens Kestra’s Slack channel, where you can get help from the Kestra team and the community. In my last contribution to the Kestra project I had a few questions which I put on Slack and the team were great to collaborate with.
Open an Issue
This opens GitHub on the Kestra repo directly on the new Issue section.
Conclusion
With these Kestra building blocks you can create almost anything easily and integrate with most platforms using the existing plugins.
Remember to start small, and keep adding to your Flow. Use plugins to help you easily integrate with 3rd party tools and platforms. Plus if you don’t want to start with a blank sheet you can use Kestra’s blueprints and customise them from there for your needs.
If this post inspires you to create something with the Open Source project Kestra, then let me know in the comments what you build.
Don’t forget to take a look at their GitHub repo so you can also contribute to their Open Source GitHub repo. Kestra has an active community on Slack, any questions you can ask there.
If you prefer to watch this tutorial: